 6
6peptides
spectra
0.000 | 0.000
0.000 | 0.000
0.000 | 0.000
0.163 | 0.318
0.140 | 0.305
0.000 | 0.016
0.459 | 0.491
0.020 | 0.059
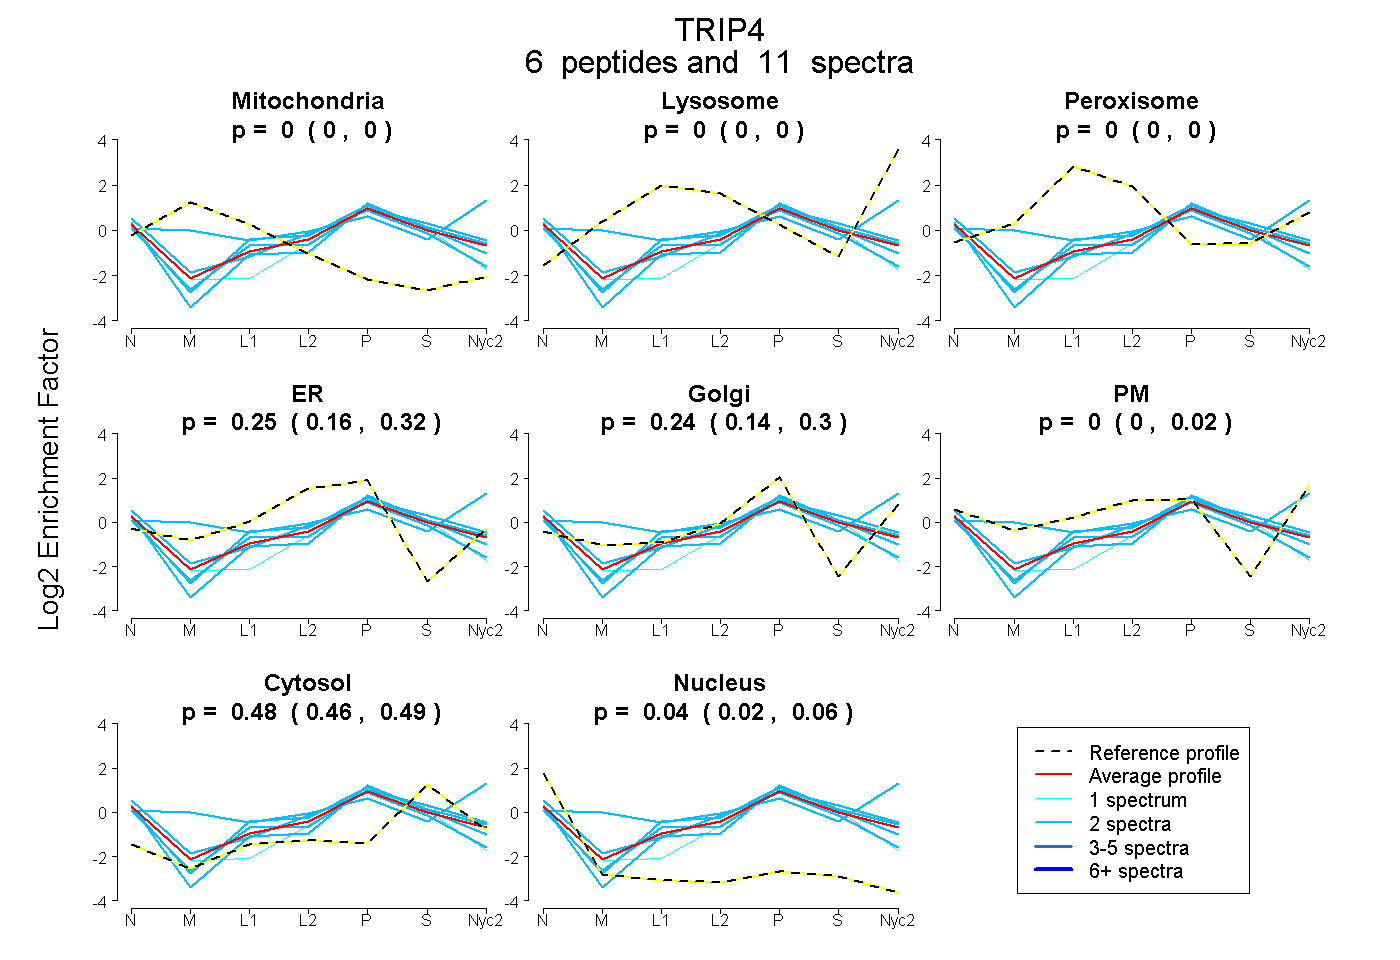
| Plot | Mito | Lyso | Perox | ER | Golgi | PM | Cytosol | Nucleus | |||||
| Expt A |
6 peptides |
11 spectra |
|
0.000 0.000 | 0.000 |
0.000 0.000 | 0.000 |
0.000 0.000 | 0.000 |
0.246 0.163 | 0.318 |
0.237 0.140 | 0.305 |
0.000 0.000 | 0.016 |
0.477 0.459 | 0.491 |
0.041 0.020 | 0.059 |
| 2 spectra, LAVLLPGR | 0.000 | 0.000 | 0.000 | 0.078 | 0.324 | 0.000 | 0.497 | 0.102 | ||
| 2 spectra, ILEDENPLAEYHSR | 0.000 | 0.000 | 0.000 | 0.157 | 0.283 | 0.000 | 0.559 | 0.000 | ||
| 2 spectra, LWIAATGK | 0.000 | 0.000 | 0.000 | 0.460 | 0.000 | 0.000 | 0.407 | 0.133 | ||
| 2 spectra, RPSTQEVSELQATYR | 0.000 | 0.126 | 0.000 | 0.000 | 0.017 | 0.552 | 0.306 | 0.000 | ||
| 2 spectra, AVAGAASGEPLVHWCTQQLR | 0.000 | 0.000 | 0.000 | 0.357 | 0.123 | 0.000 | 0.520 | 0.000 | ||
| 1 spectrum, HPCDCLGQK | 0.000 | 0.000 | 0.000 | 0.244 | 0.132 | 0.000 | 0.454 | 0.170 |
| Plot | Mito | Lyso or Perox | ER | Golgi | PM | Cytosol | Nucleus | ||||||
| Expt B |
3 peptides |
3 spectra |
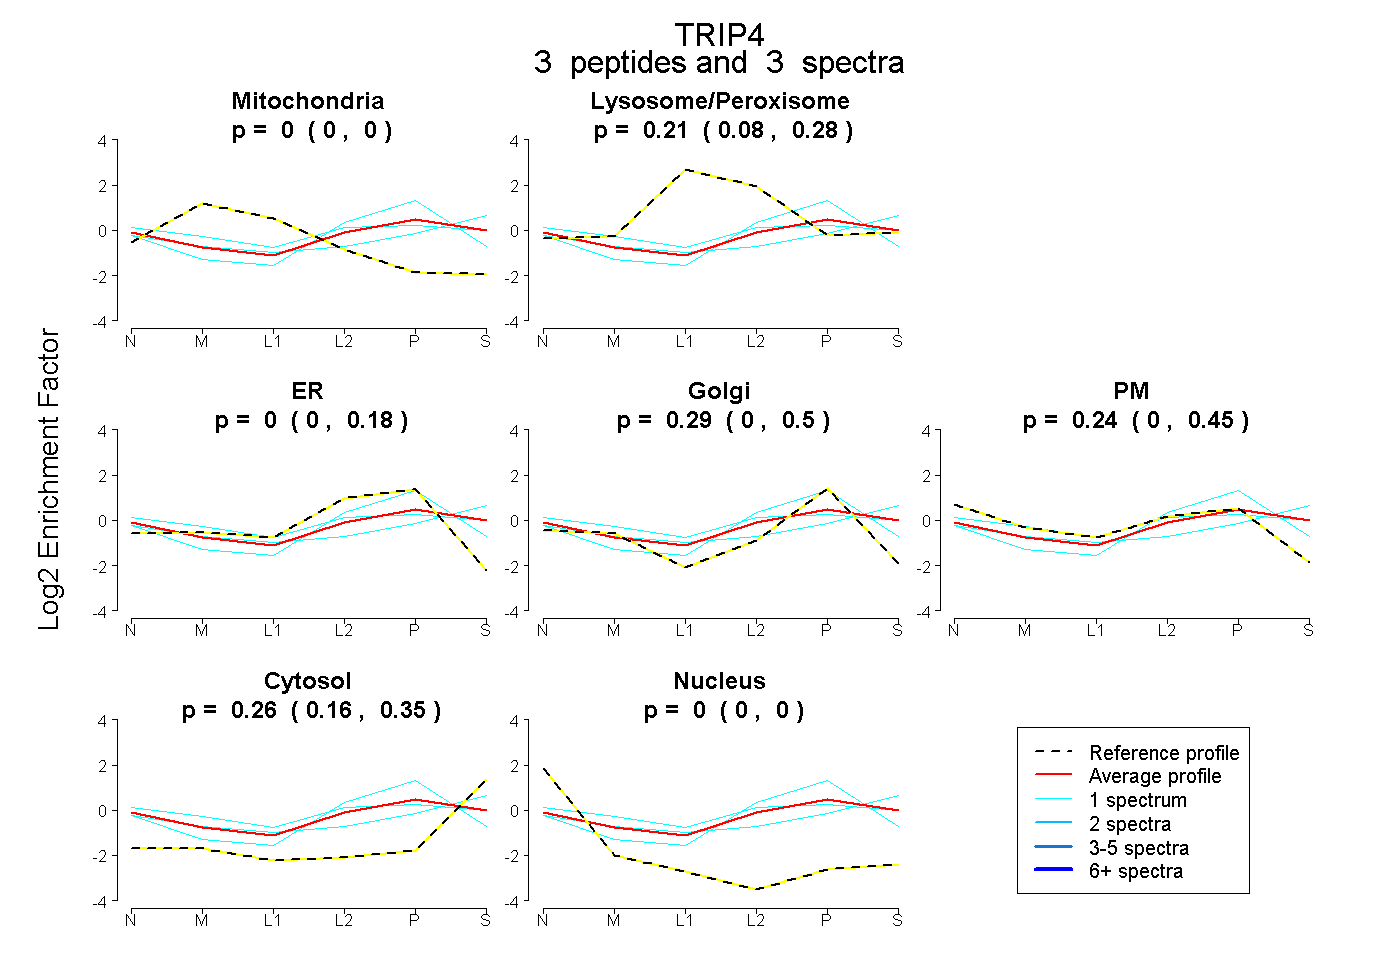 |
0.000 0.000 | 0.000 |
0.205 0.081 | 0.276 |
0.000 0.000 | 0.180 |
0.292 0.000 | 0.502 |
0.241 0.003 | 0.455 |
0.262 0.162 | 0.353 |
0.000 0.000 | 0.000 |
|||
| Plot | Lyso | Other | |||||||||||
| Expt C |
5 peptides |
6 spectra |
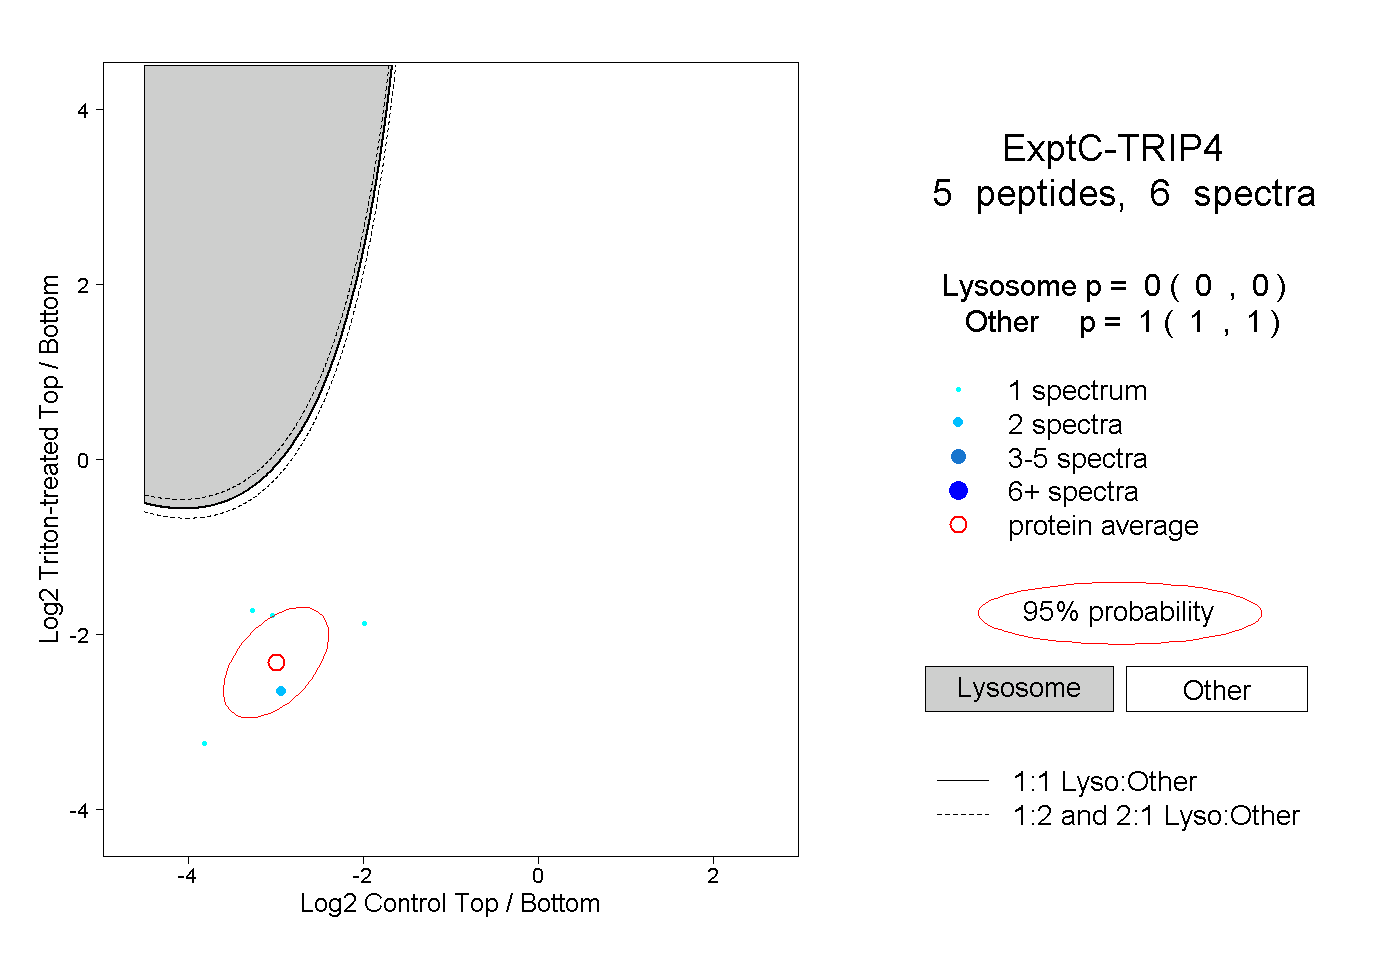 |
0.000 0.000 | 0.000 |
1.000 1.000 | 1.000 |