 28
28peptides
spectra
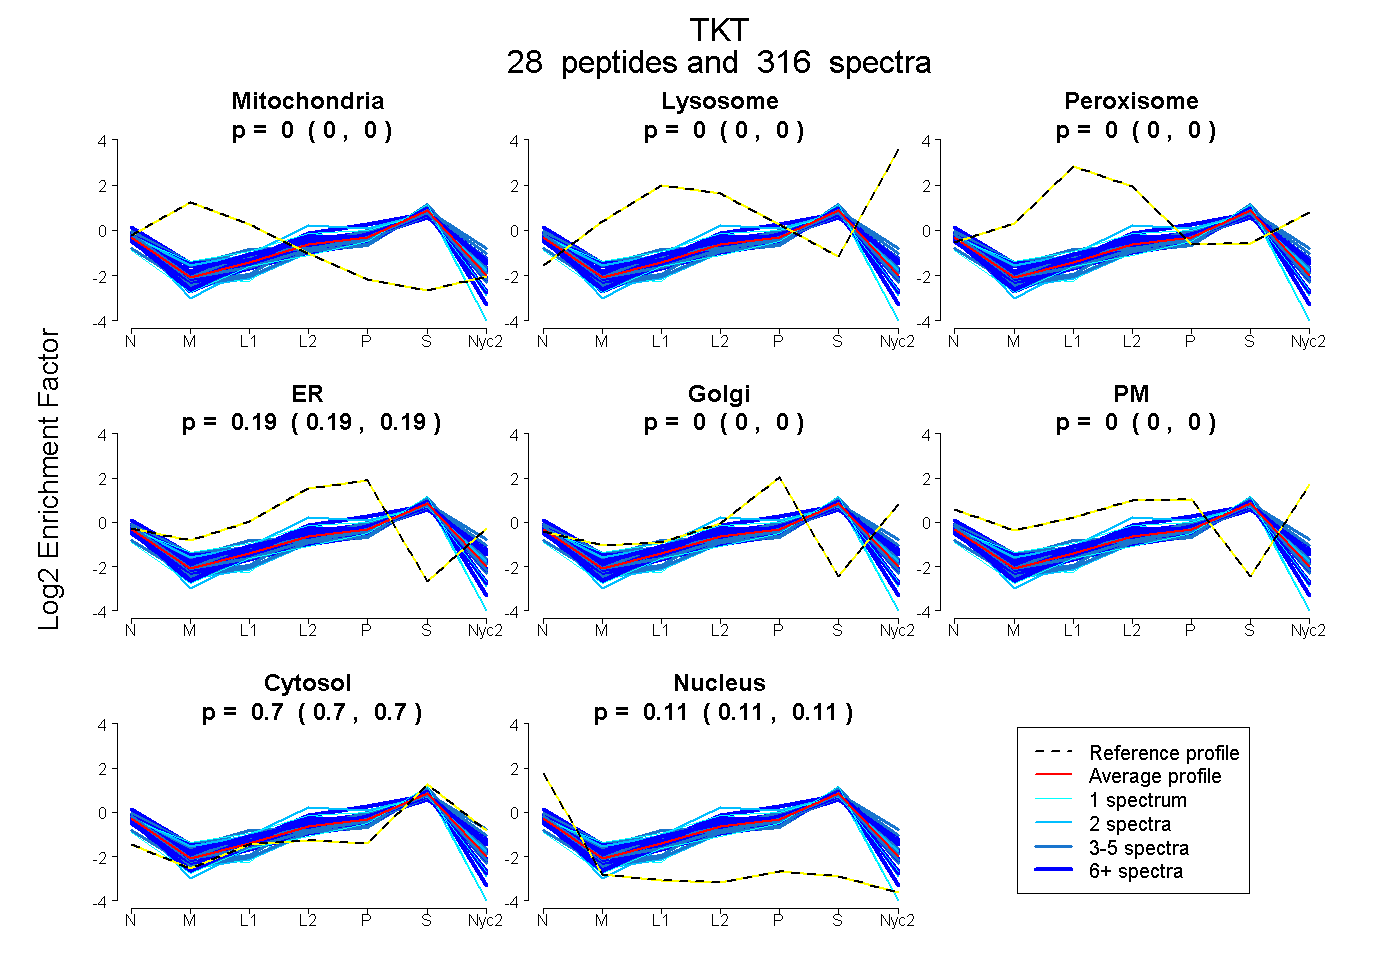
0.000 | 0.000
0.000 | 0.000
0.000 | 0.000
0.188 | 0.190
0.000 | 0.000
0.000 | 0.000
0.703 | 0.705
0.106 | 0.108
19peptides
spectra
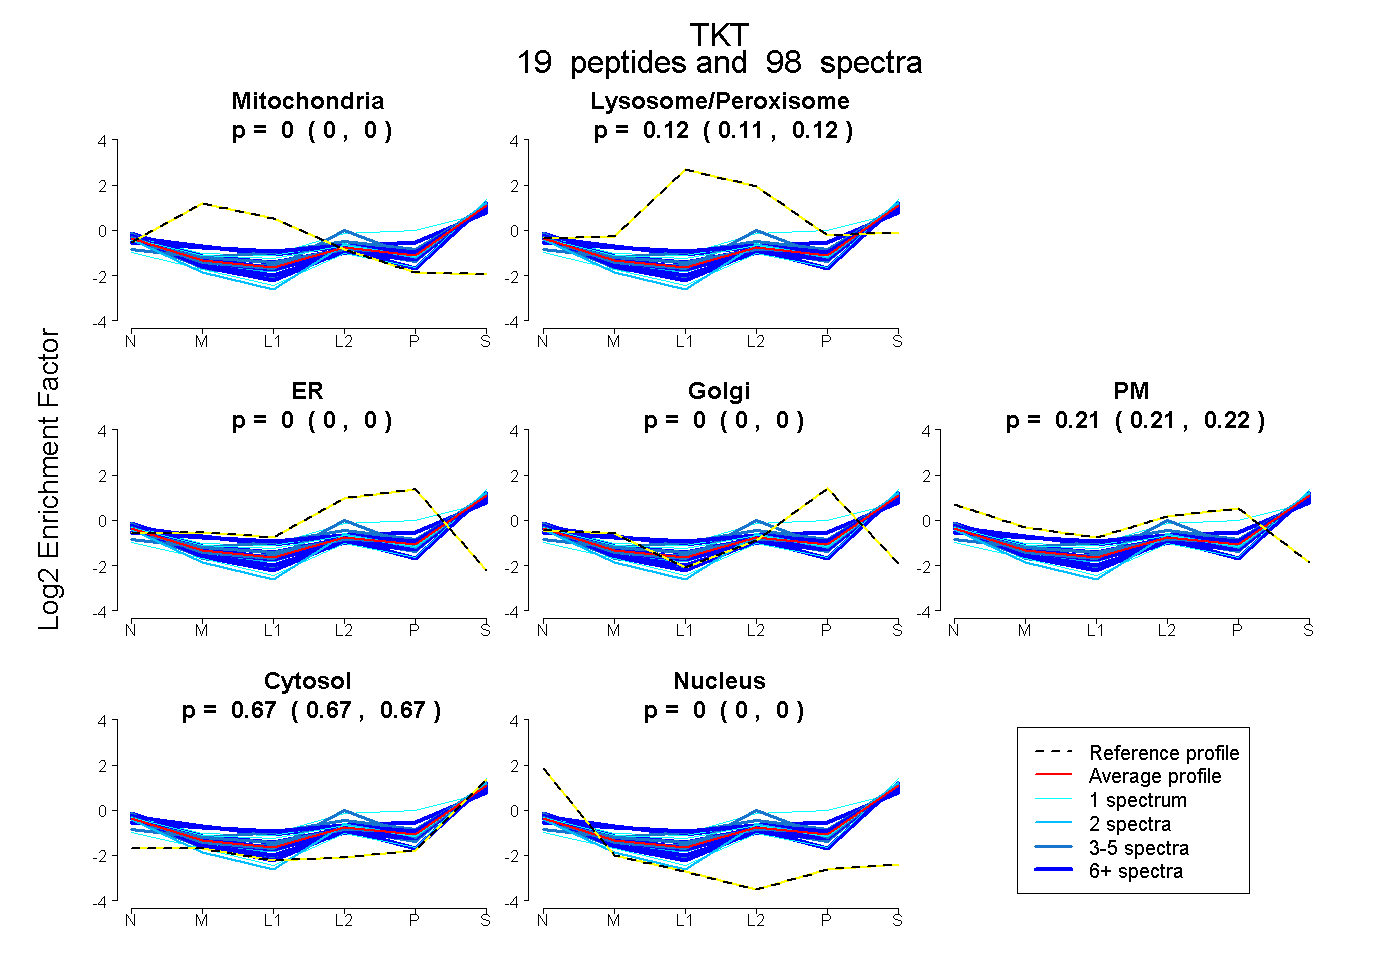
0.000 | 0.000
0.113 | 0.121
0.000 | 0.000
0.000 | 0.000
0.209 | 0.216
0.667 | 0.672
0.000 | 0.000
25peptides
spectra
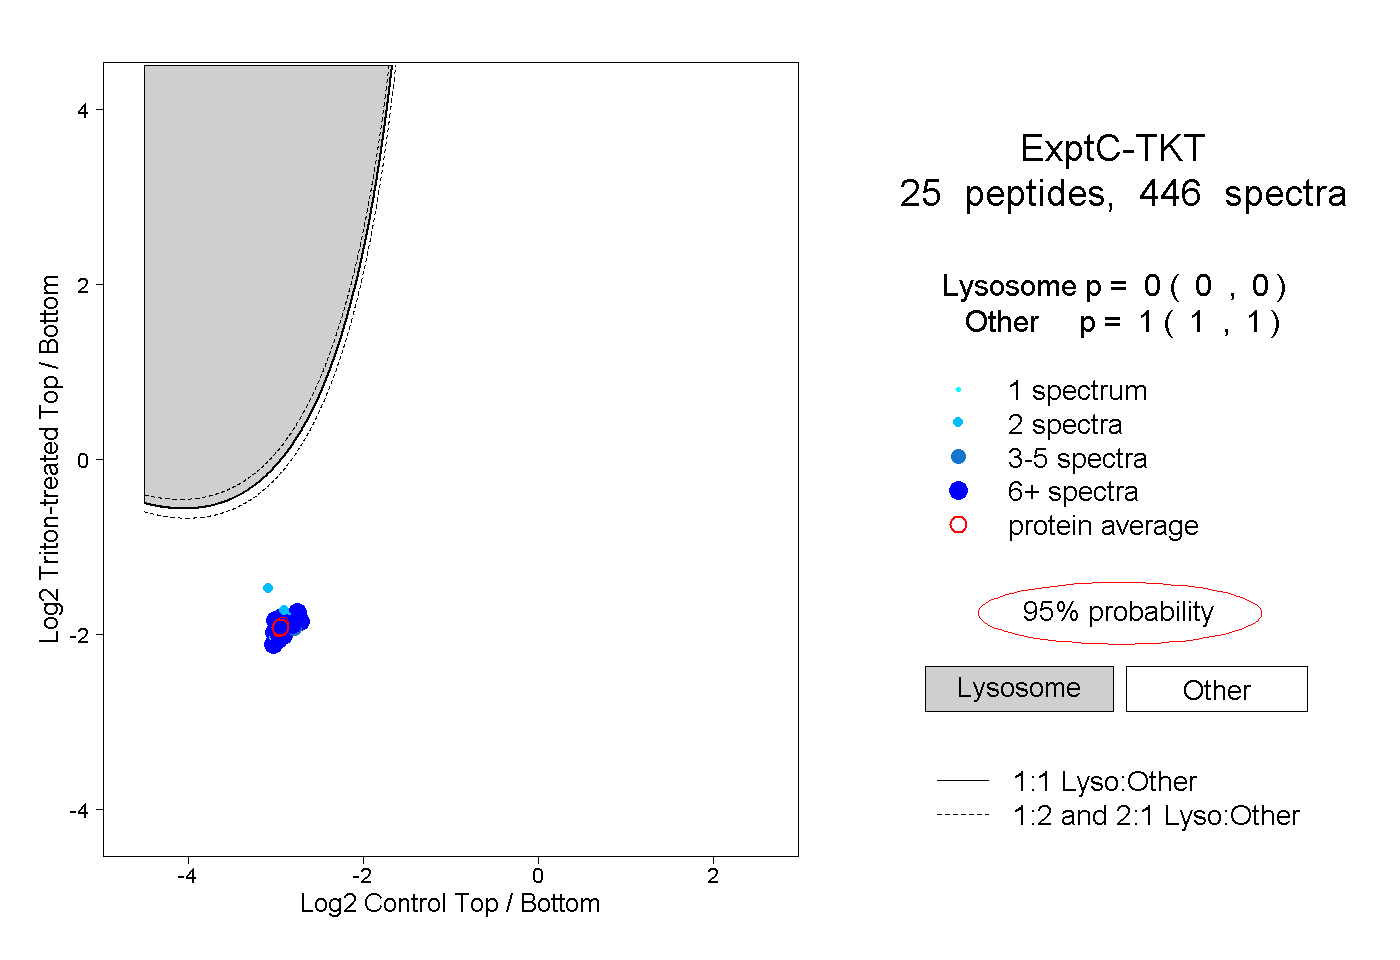
0.000 | 0.000
1.000 | 1.000
14peptides
spectra
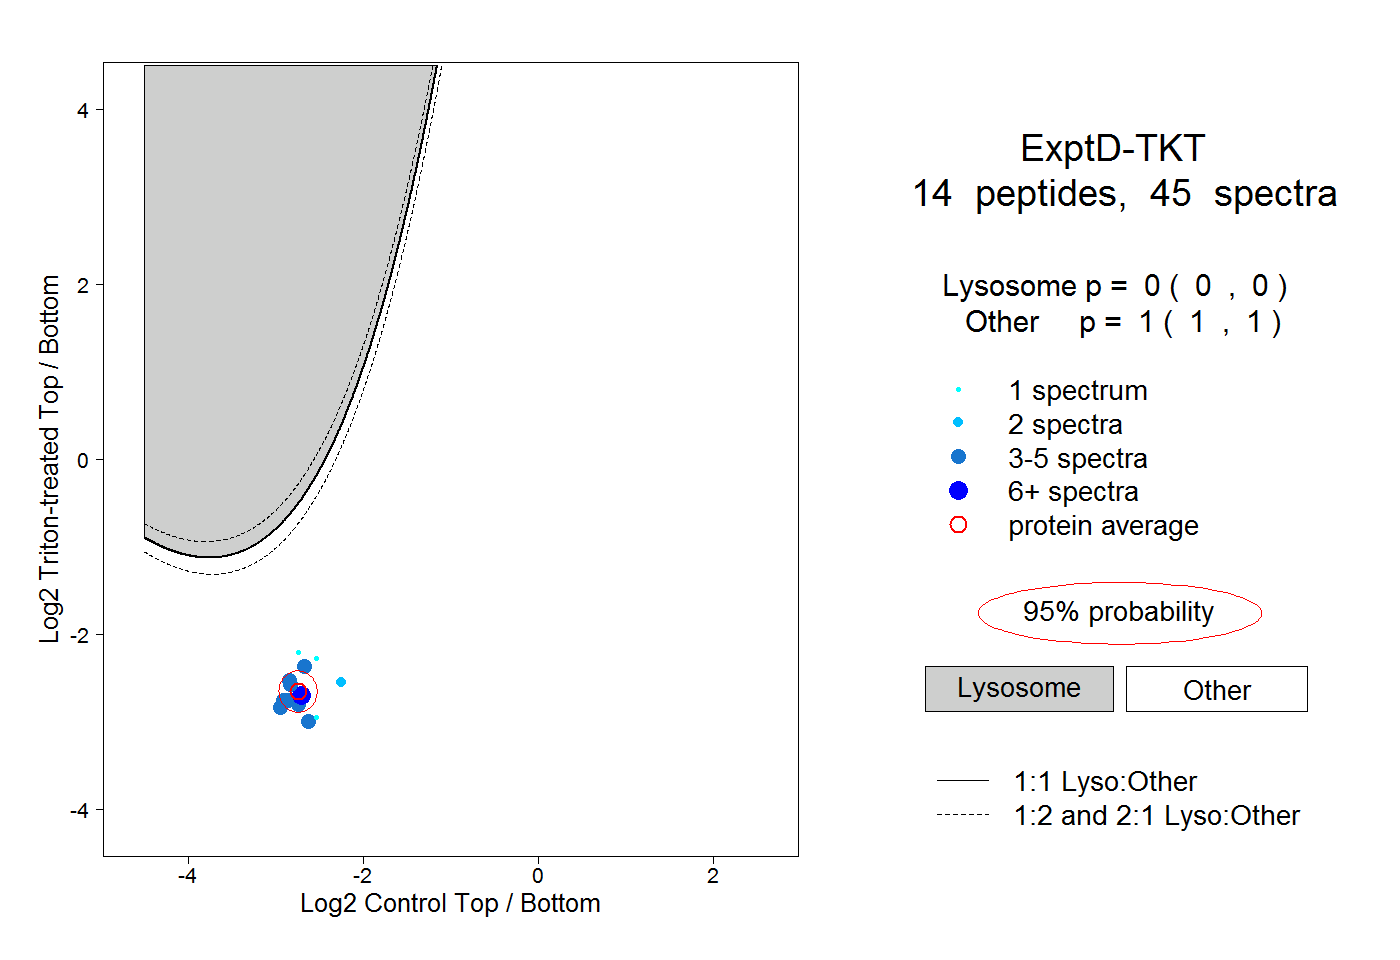
0.000 | 0.000
1.000 | 1.000