 5
5peptides
spectra
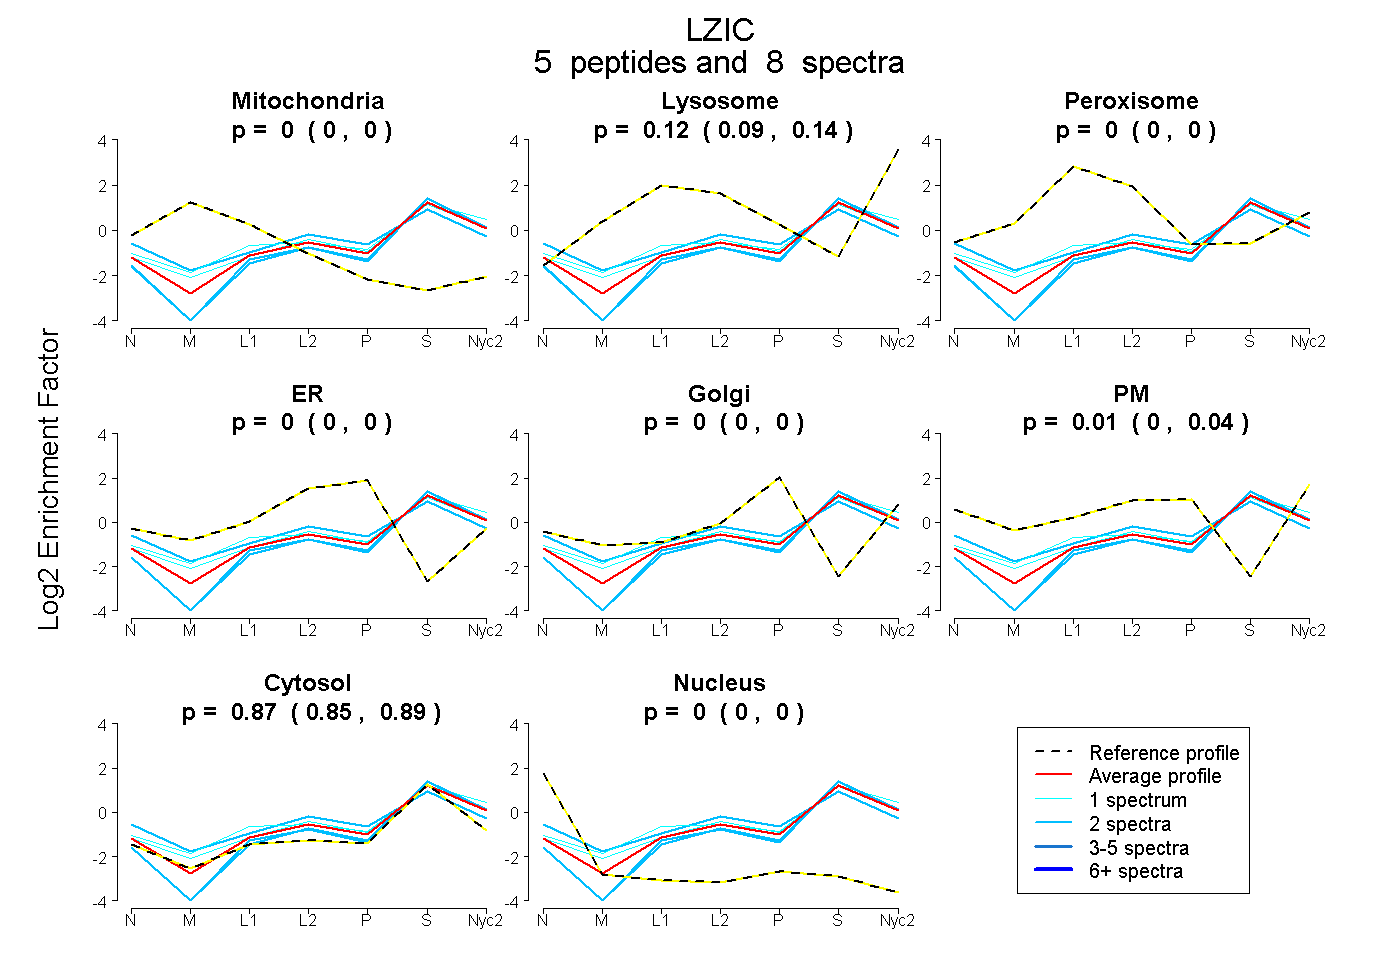
0.000 | 0.000
0.090 | 0.144
0.000 | 0.000
0.000 | 0.000
0.000 | 0.000
0.000 | 0.036
0.845 | 0.888
0.000 | 0.000
| Plot | Mito | Lyso | Perox | ER | Golgi | PM | Cytosol | Nucleus | |||||
| Expt A |
5 peptides |
8 spectra |
|
0.000 0.000 | 0.000 |
0.123 0.090 | 0.144 |
0.000 0.000 | 0.000 |
0.000 0.000 | 0.000 |
0.000 0.000 | 0.000 |
0.007 0.000 | 0.036 |
0.870 0.845 | 0.888 |
0.000 0.000 | 0.000 |
| 1 spectrum, TPEVIR | 0.000 | 0.146 | 0.064 | 0.000 | 0.000 | 0.020 | 0.770 | 0.000 | ||
| 2 spectra, VLALAGFEVEK | 0.000 | 0.022 | 0.000 | 0.000 | 0.000 | 0.000 | 0.978 | 0.000 | ||
| 1 spectrum, QNLEEQLDR | 0.000 | 0.201 | 0.000 | 0.000 | 0.000 | 0.000 | 0.799 | 0.000 | ||
| 2 spectra, VEILTALR | 0.000 | 0.027 | 0.000 | 0.000 | 0.000 | 0.000 | 0.973 | 0.000 | ||
| 2 spectra, DLHTQQK | 0.000 | 0.000 | 0.096 | 0.011 | 0.000 | 0.173 | 0.721 | 0.000 |
| Plot | Lyso | Other | |||||||||||
| Expt C |
3 peptides |
5 spectra |
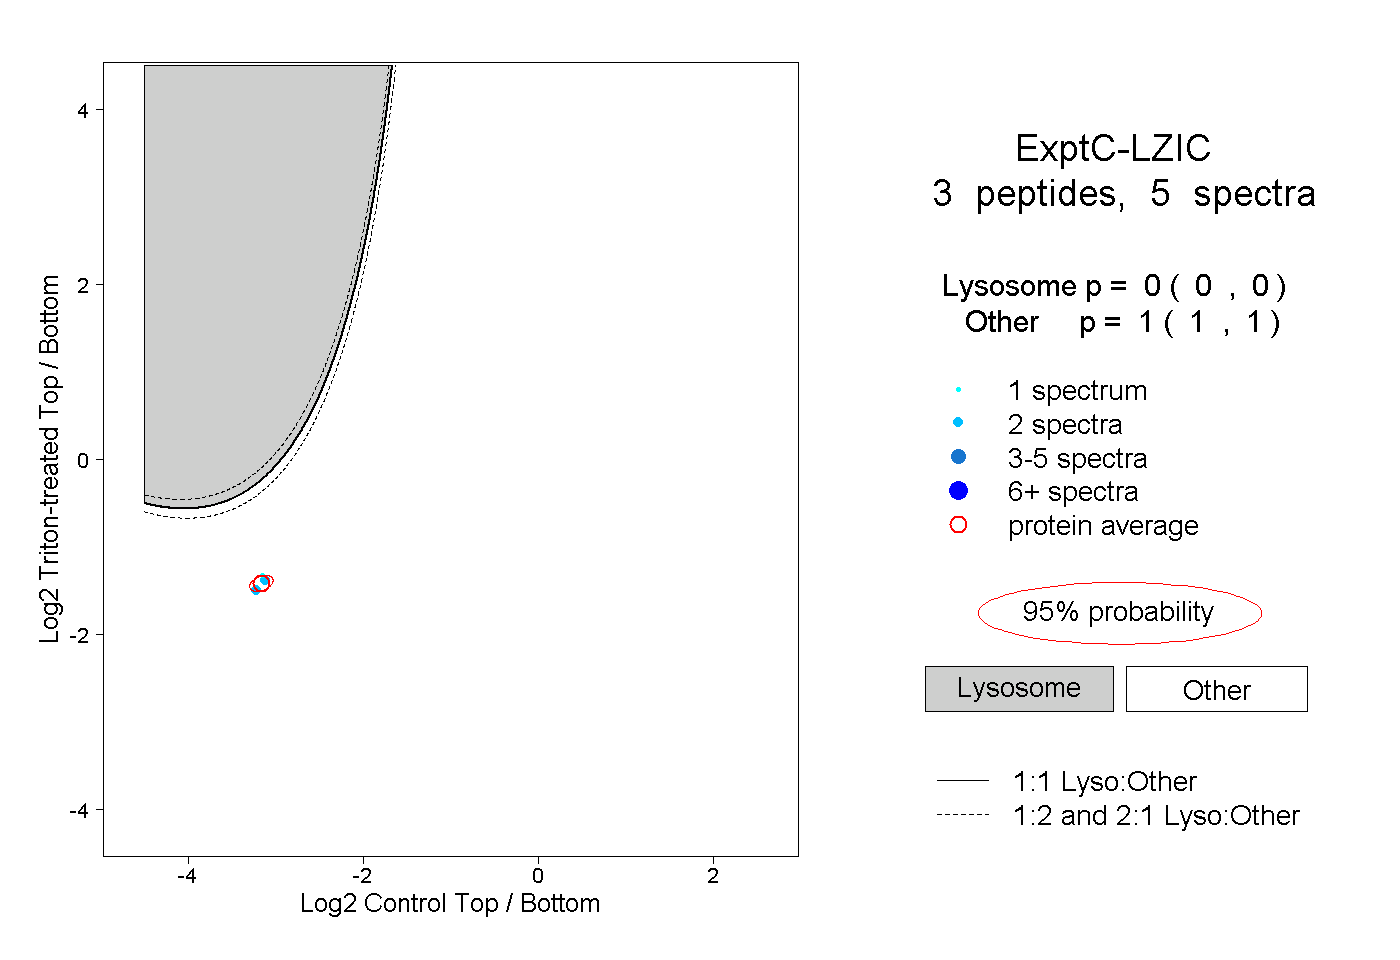 |
0.000 0.000 | 0.000 |
1.000 1.000 | 1.000 |