 24
24peptides
spectra
0.000 | 0.000
0.868 | 0.872
0.000 | 0.000
0.000 | 0.000
0.000 | 0.000
0.000 | 0.000
0.128 | 0.132
0.000 | 0.000
| Plot | Mito | Lyso | Perox | ER | Golgi | PM | Cytosol | Nucleus | |||||
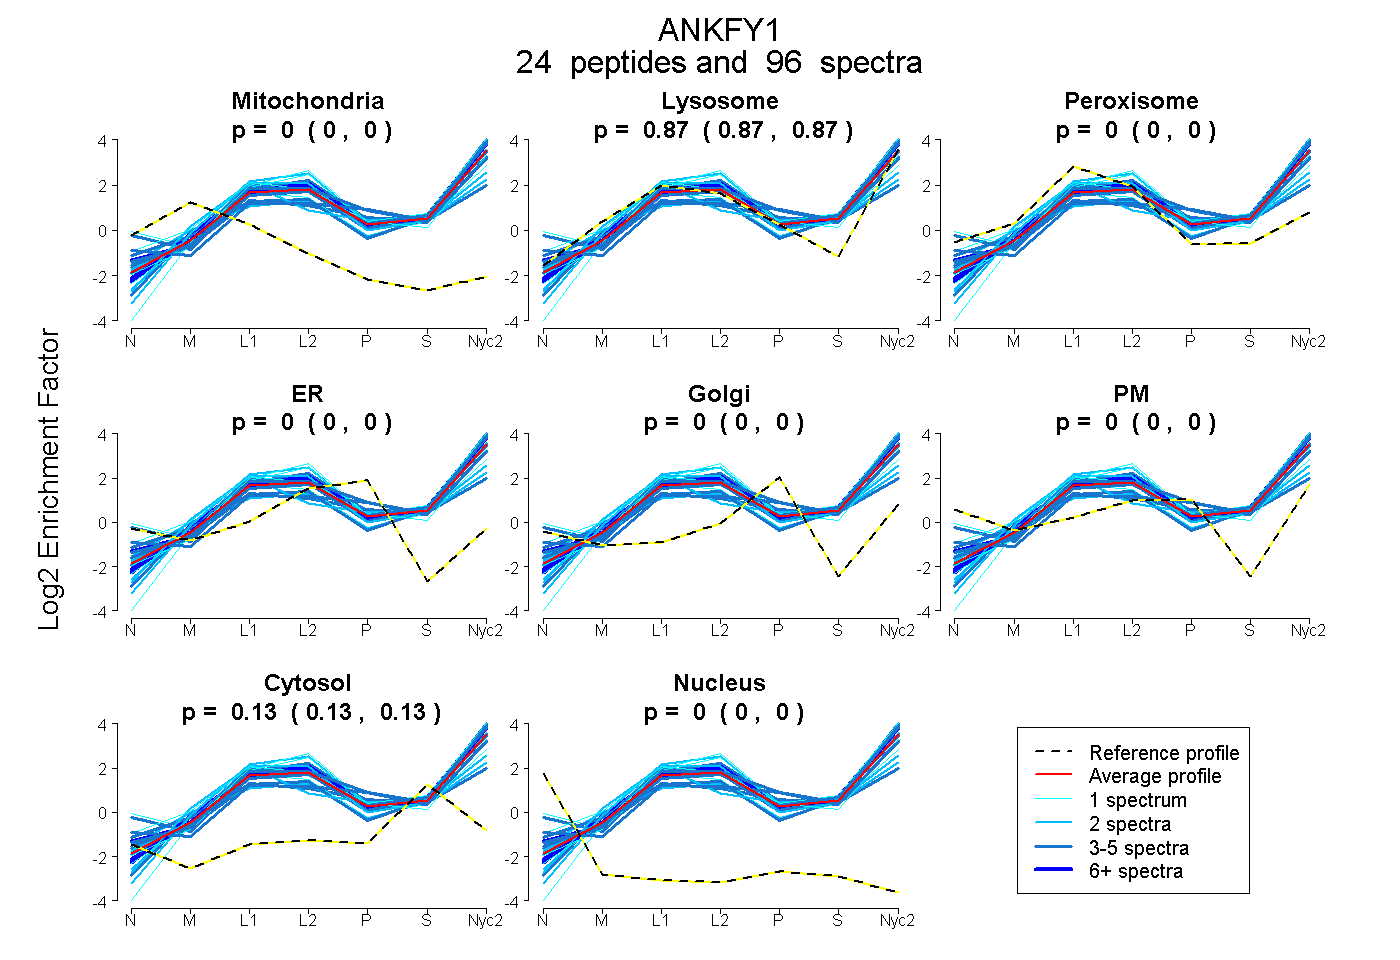
| Expt A |
24 peptides |
96 spectra |
|
0.000 0.000 | 0.000 |
0.870 0.868 | 0.872 |
0.000 0.000 | 0.000 |
0.000 0.000 | 0.000 |
0.000 0.000 | 0.000 |
0.000 0.000 | 0.000 |
0.130 0.128 | 0.132 |
0.000 0.000 | 0.000 |
| 2 spectra, CTLLAAQANK | 0.000 | 0.710 | 0.043 | 0.000 | 0.000 | 0.000 | 0.246 | 0.000 | ||
| 7 spectra, FVLAAR | 0.000 | 0.924 | 0.000 | 0.000 | 0.000 | 0.000 | 0.076 | 0.000 | ||
| 1 spectrum, QGLTPFACAMTYK | 0.000 | 0.809 | 0.150 | 0.000 | 0.000 | 0.000 | 0.042 | 0.000 | ||
| 1 spectrum, AIDENNESTACFLIR | 0.000 | 0.582 | 0.246 | 0.000 | 0.000 | 0.000 | 0.171 | 0.000 | ||
| 3 spectra, SALFLLEHQADINVR | 0.000 | 0.872 | 0.000 | 0.000 | 0.000 | 0.000 | 0.128 | 0.000 | ||
| 1 spectrum, QLDIELK | 0.000 | 0.875 | 0.000 | 0.000 | 0.000 | 0.000 | 0.125 | 0.000 | ||
| 2 spectra, ESGAAEQVDNK | 0.000 | 0.846 | 0.000 | 0.000 | 0.000 | 0.000 | 0.154 | 0.000 | ||
| 33 spectra, HLMLLR | 0.000 | 0.911 | 0.000 | 0.000 | 0.000 | 0.000 | 0.089 | 0.000 | ||
| 3 spectra, FQLQLLR | 0.000 | 0.896 | 0.000 | 0.000 | 0.000 | 0.000 | 0.104 | 0.000 | ||
| 3 spectra, GNANLCR | 0.000 | 0.360 | 0.420 | 0.000 | 0.000 | 0.037 | 0.183 | 0.000 | ||
| 2 spectra, GQSPLHILGQYGK | 0.000 | 0.861 | 0.000 | 0.000 | 0.000 | 0.000 | 0.139 | 0.000 | ||
| 4 spectra, SGCDVNSPR | 0.000 | 0.866 | 0.008 | 0.000 | 0.000 | 0.000 | 0.126 | 0.000 | ||
| 2 spectra, AAEAILK | 0.000 | 0.904 | 0.000 | 0.000 | 0.000 | 0.000 | 0.096 | 0.000 | ||
| 1 spectrum, NQLPLVVDAICTR | 0.000 | 0.942 | 0.000 | 0.000 | 0.000 | 0.000 | 0.058 | 0.000 | ||
| 8 spectra, FGVTTR | 0.000 | 0.879 | 0.000 | 0.000 | 0.000 | 0.000 | 0.121 | 0.000 | ||
| 3 spectra, GDLFASTFLIK | 0.000 | 0.812 | 0.000 | 0.000 | 0.000 | 0.000 | 0.188 | 0.000 | ||
| 3 spectra, WIYTDELEFR | 0.000 | 0.830 | 0.000 | 0.000 | 0.000 | 0.000 | 0.170 | 0.000 | ||
| 4 spectra, FDLNKPVR | 0.000 | 0.930 | 0.000 | 0.000 | 0.000 | 0.000 | 0.070 | 0.000 | ||
| 1 spectrum, ENSSESFISR | 0.000 | 0.940 | 0.000 | 0.000 | 0.000 | 0.000 | 0.060 | 0.000 | ||
| 2 spectra, NEYVFNQLLQCK | 0.000 | 0.653 | 0.235 | 0.000 | 0.000 | 0.000 | 0.113 | 0.000 | ||
| 1 spectrum, LNETDHNGDLALDLALSR | 0.000 | 0.965 | 0.000 | 0.000 | 0.000 | 0.000 | 0.035 | 0.000 | ||
| 3 spectra, ADVDMVDK | 0.000 | 0.795 | 0.000 | 0.000 | 0.000 | 0.000 | 0.205 | 0.000 | ||
| 4 spectra, GVMSLVNVR | 0.000 | 0.910 | 0.000 | 0.000 | 0.000 | 0.000 | 0.090 | 0.000 | ||
| 2 spectra, LLDMLSK | 0.000 | 0.993 | 0.000 | 0.000 | 0.000 | 0.000 | 0.007 | 0.000 |
| Plot | Mito | Lyso or Perox | ER | Golgi | PM | Cytosol | Nucleus | ||||||
| Expt B |
21 peptides |
61 spectra |
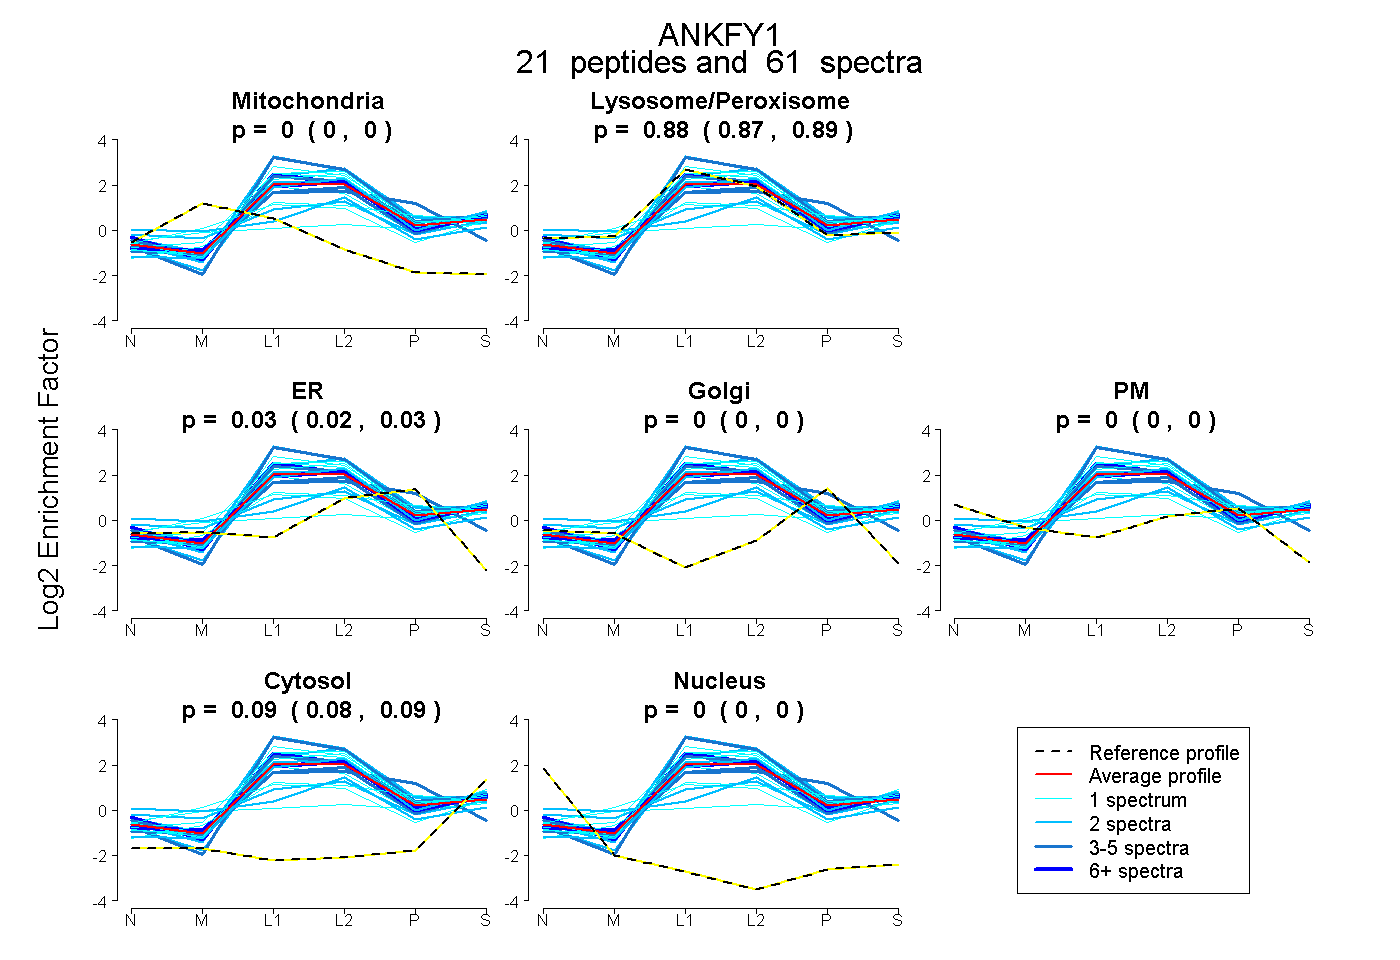 |
0.000 0.000 | 0.000 |
0.884 0.875 | 0.891 |
0.027 0.019 | 0.033 |
0.000 0.000 | 0.000 |
0.000 0.000 | 0.000 |
0.089 0.084 | 0.093 |
0.000 0.000 | 0.000 |
|||
| Plot | Lyso | Other | |||||||||||
| Expt C |
37 peptides |
322 spectra |
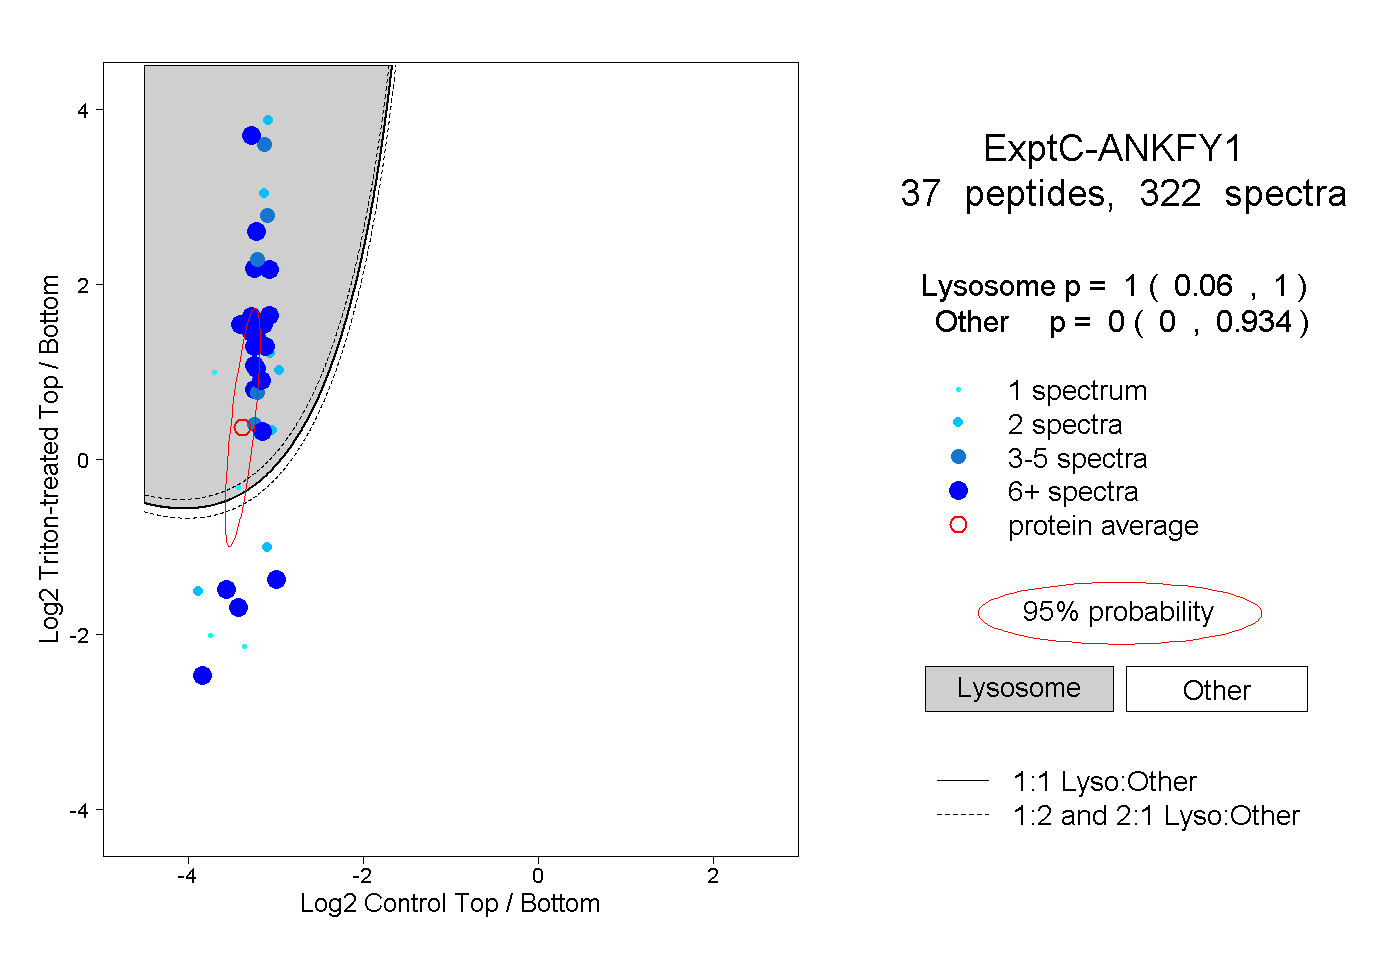 |
1.000 0.060 | 1.000 |
0.000 0.000 | 0.934 |
||||||||
| Plot | Lyso | Other | |||||||||||
| Expt D |
8 peptides |
32 spectra |
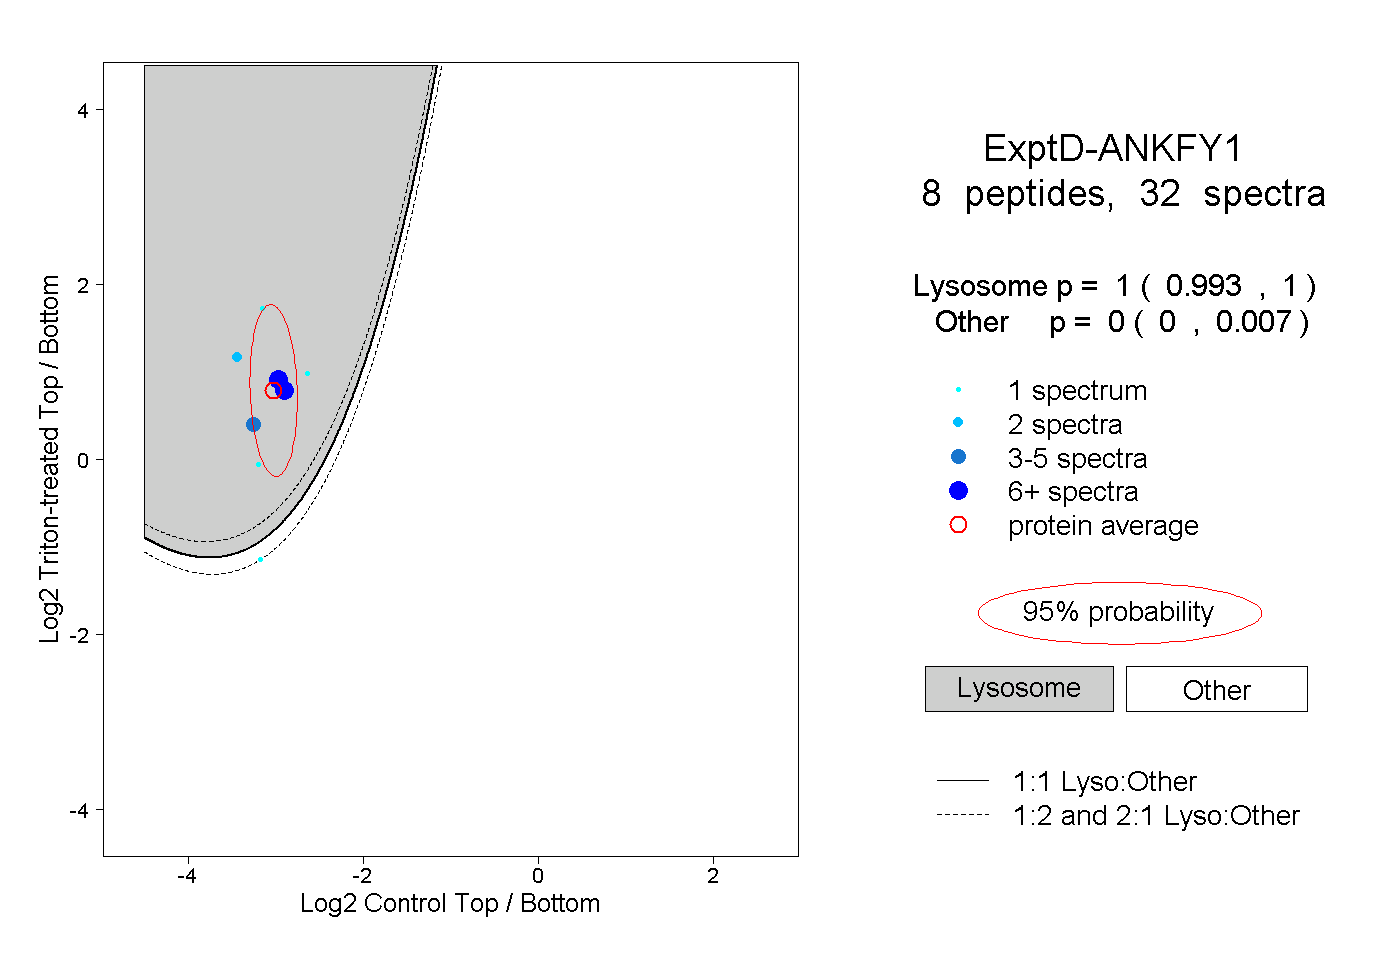 |
1.000 0.993 | 1.000 |
0.000 0.000 | 0.007 |