 24
24peptides
spectra
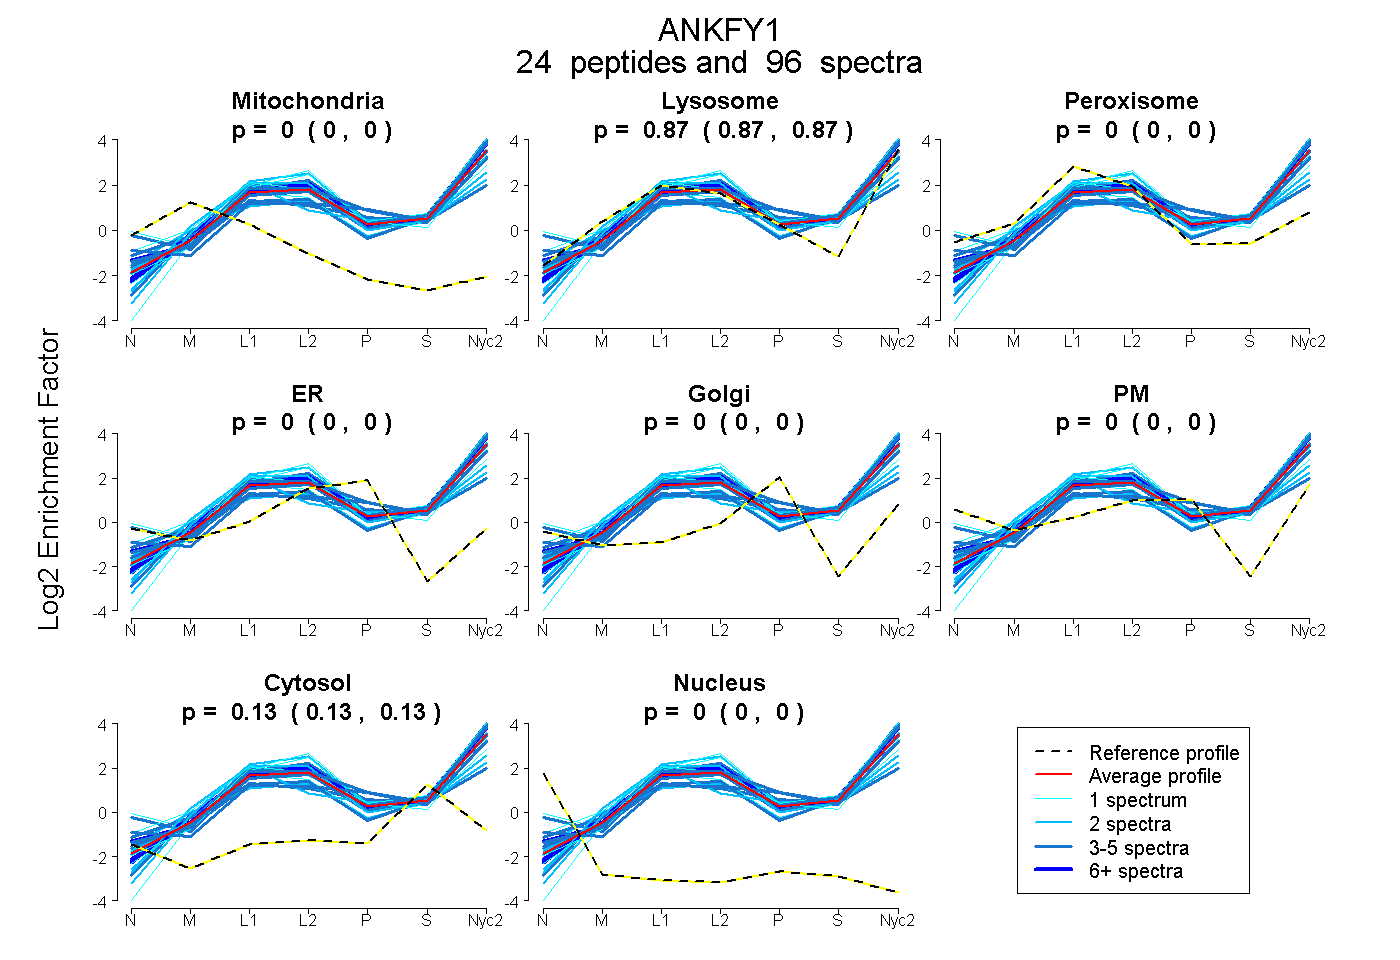
0.000 | 0.000
0.868 | 0.872
0.000 | 0.000
0.000 | 0.000
0.000 | 0.000
0.000 | 0.000
0.128 | 0.132
0.000 | 0.000
21peptides
spectra
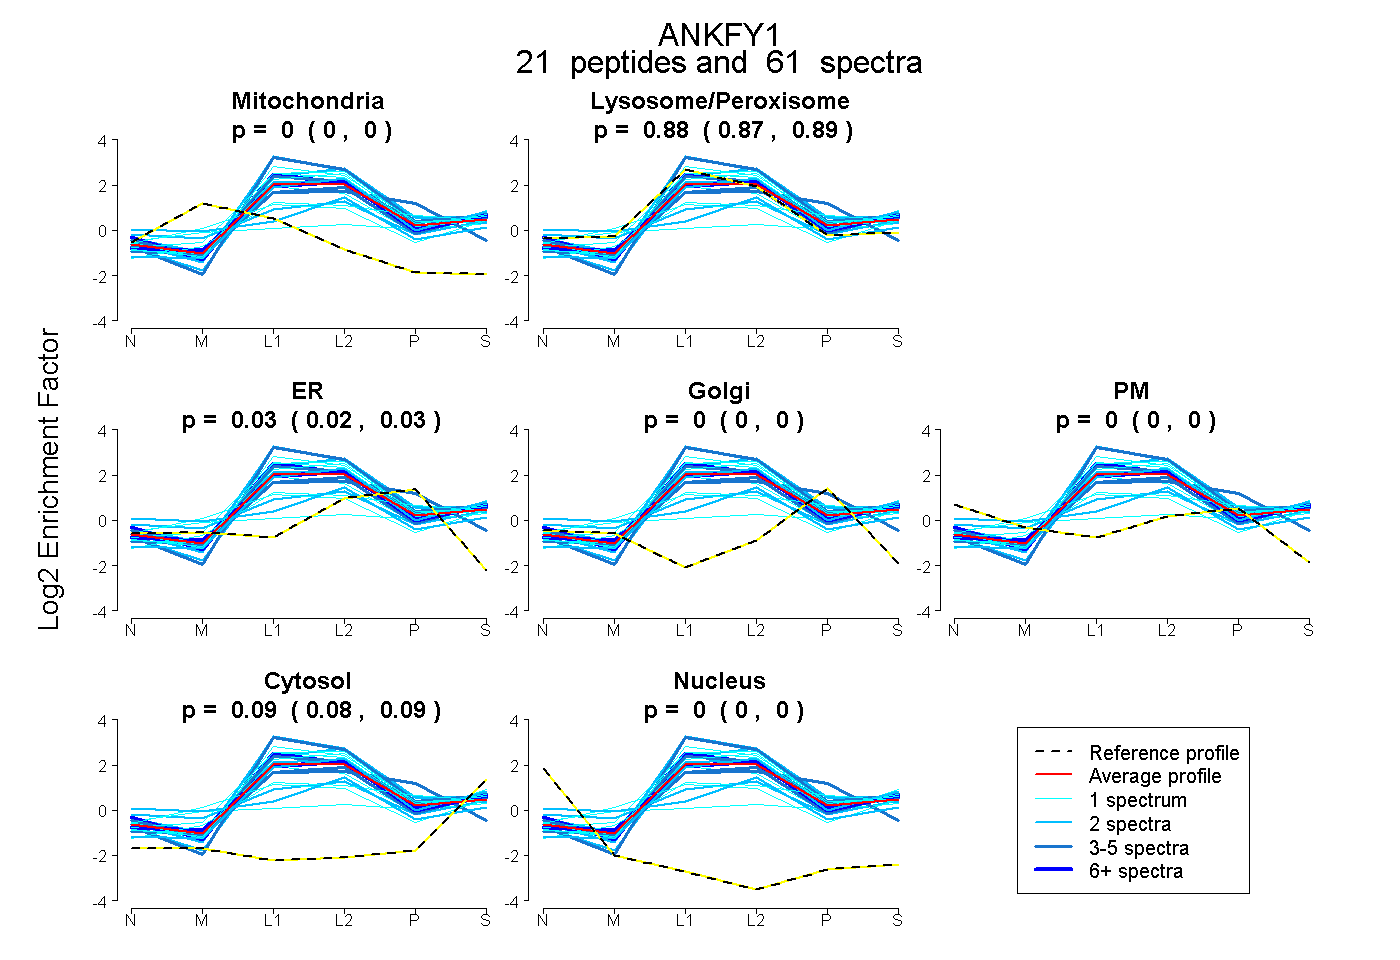
0.000 | 0.000
0.875 | 0.891
0.019 | 0.033
0.000 | 0.000
0.000 | 0.000
0.084 | 0.093
0.000 | 0.000
37peptides
spectra
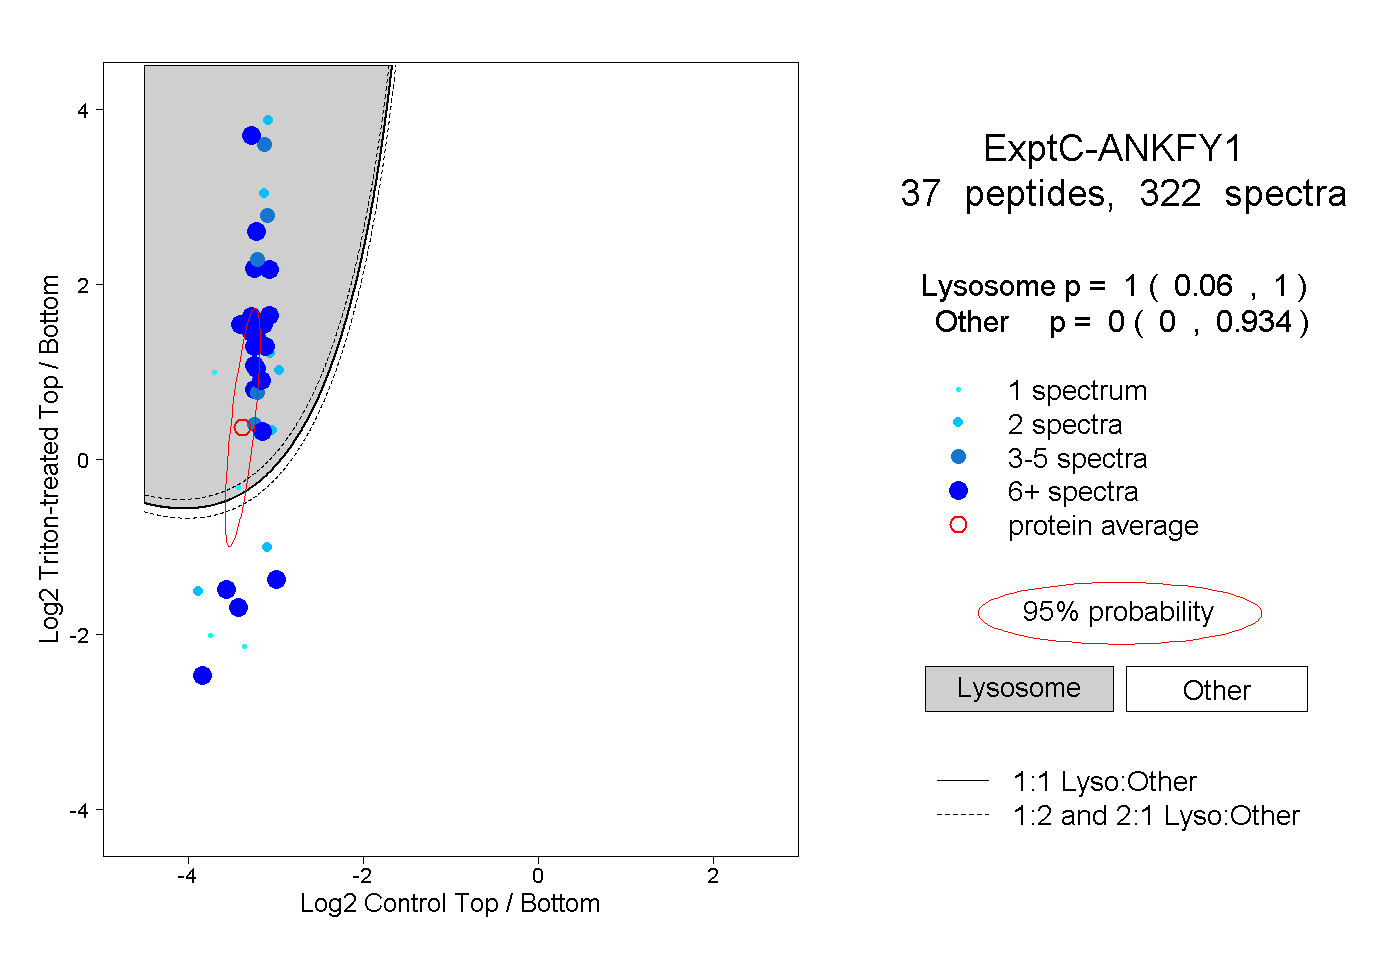
0.060 | 1.000
0.000 | 0.934
8peptides
spectra
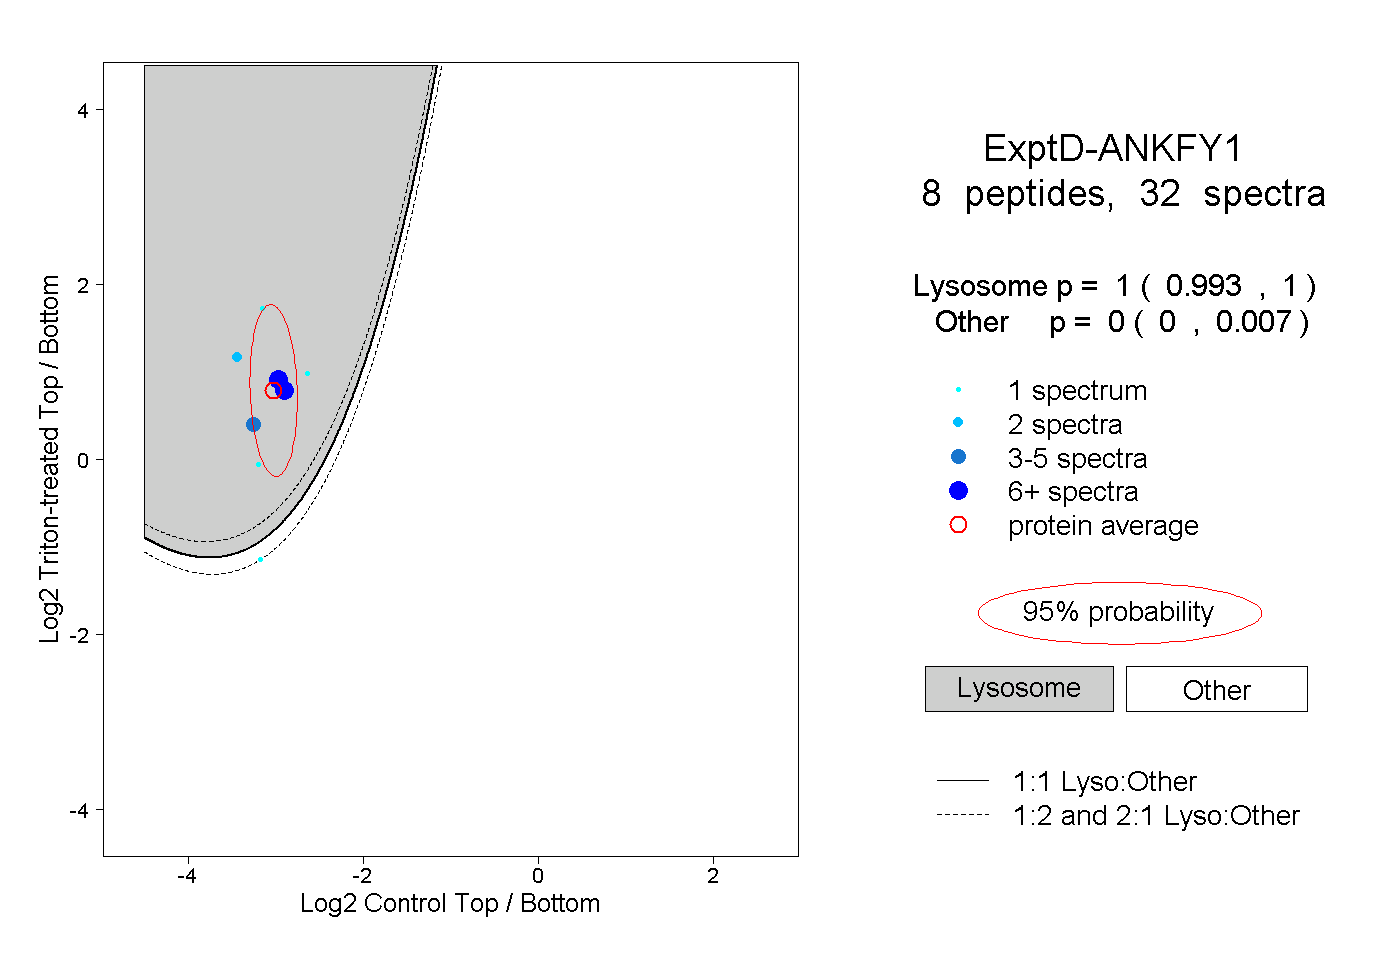
0.993 | 1.000
0.000 | 0.007