 16
16peptides
spectra
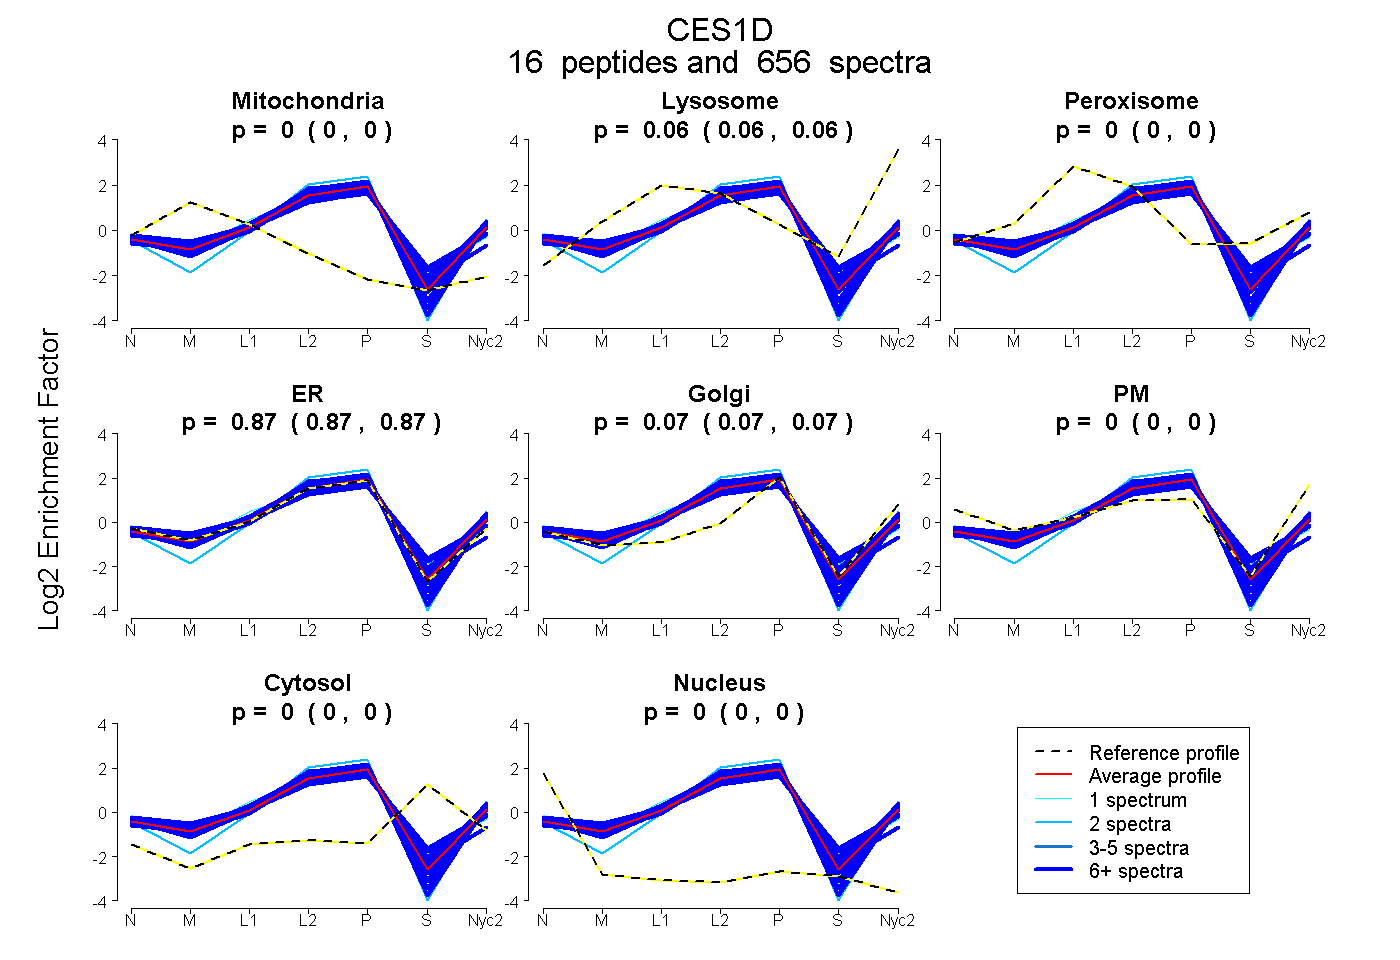
0.000 | 0.000
0.060 | 0.062
0.000 | 0.000
0.865 | 0.870
0.069 | 0.072
0.000 | 0.000
0.000 | 0.000
0.000 | 0.000
16peptides
spectra
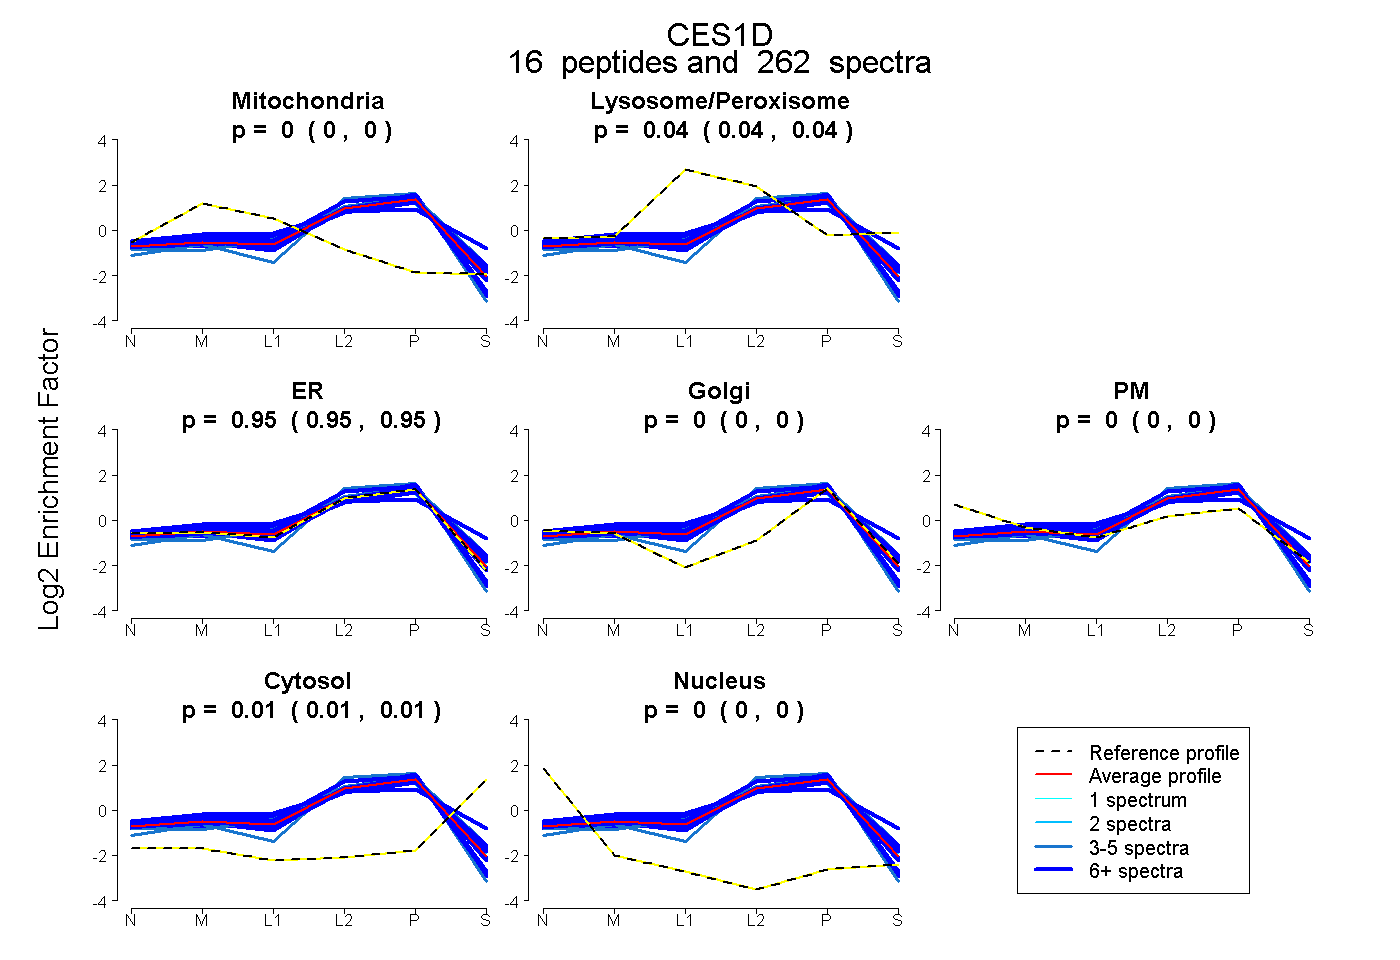
0.000 | 0.000
0.038 | 0.042
0.946 | 0.953
0.000 | 0.000
0.000 | 0.000
0.009 | 0.012
0.000 | 0.000
15peptides
spectra
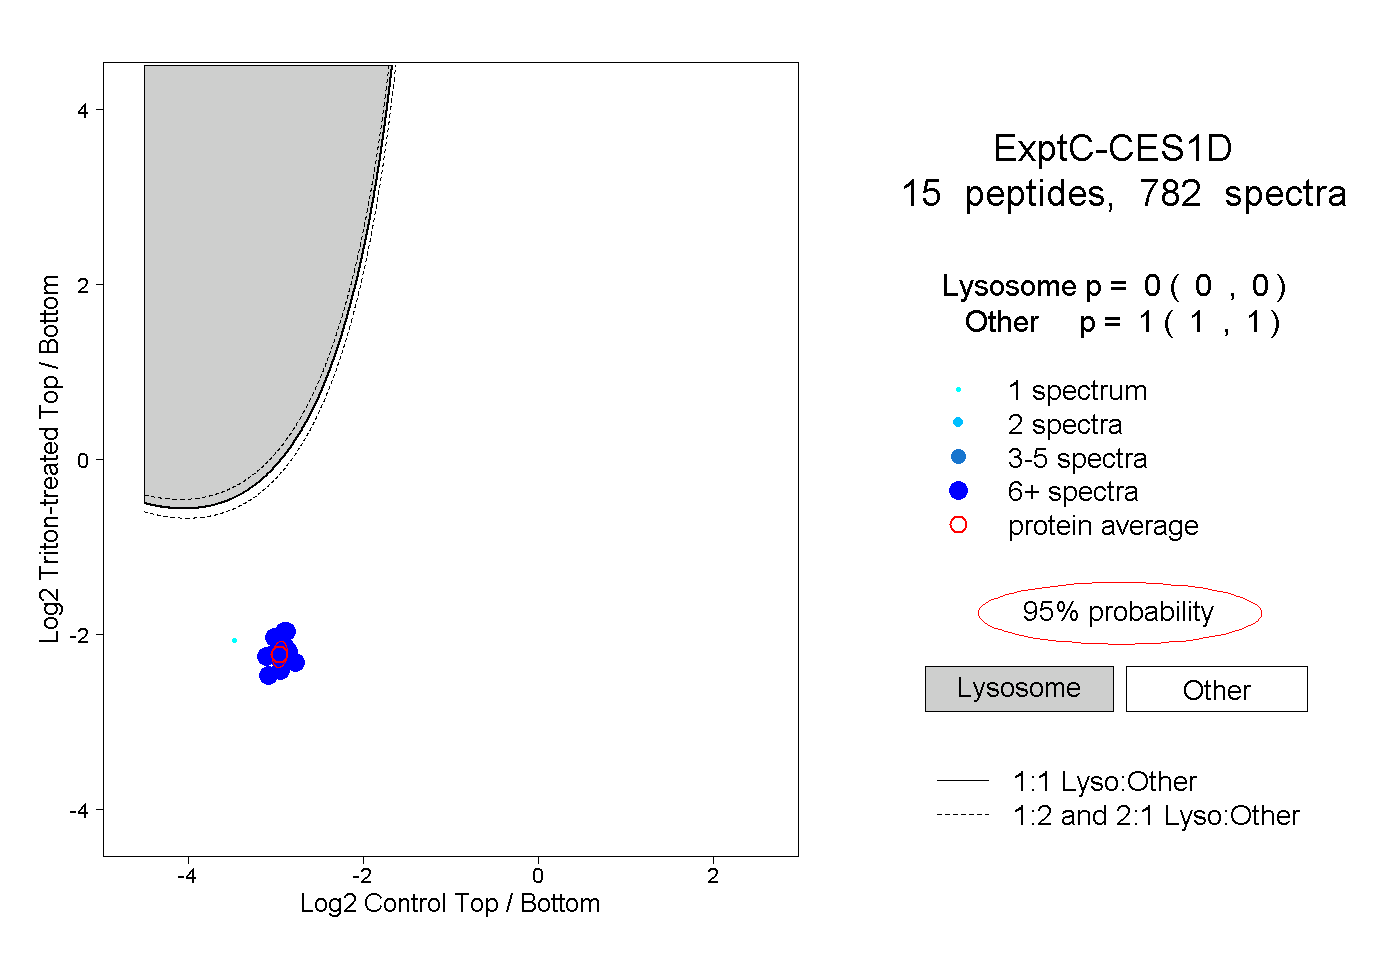
0.000 | 0.000
1.000 | 1.000
13peptides
spectra
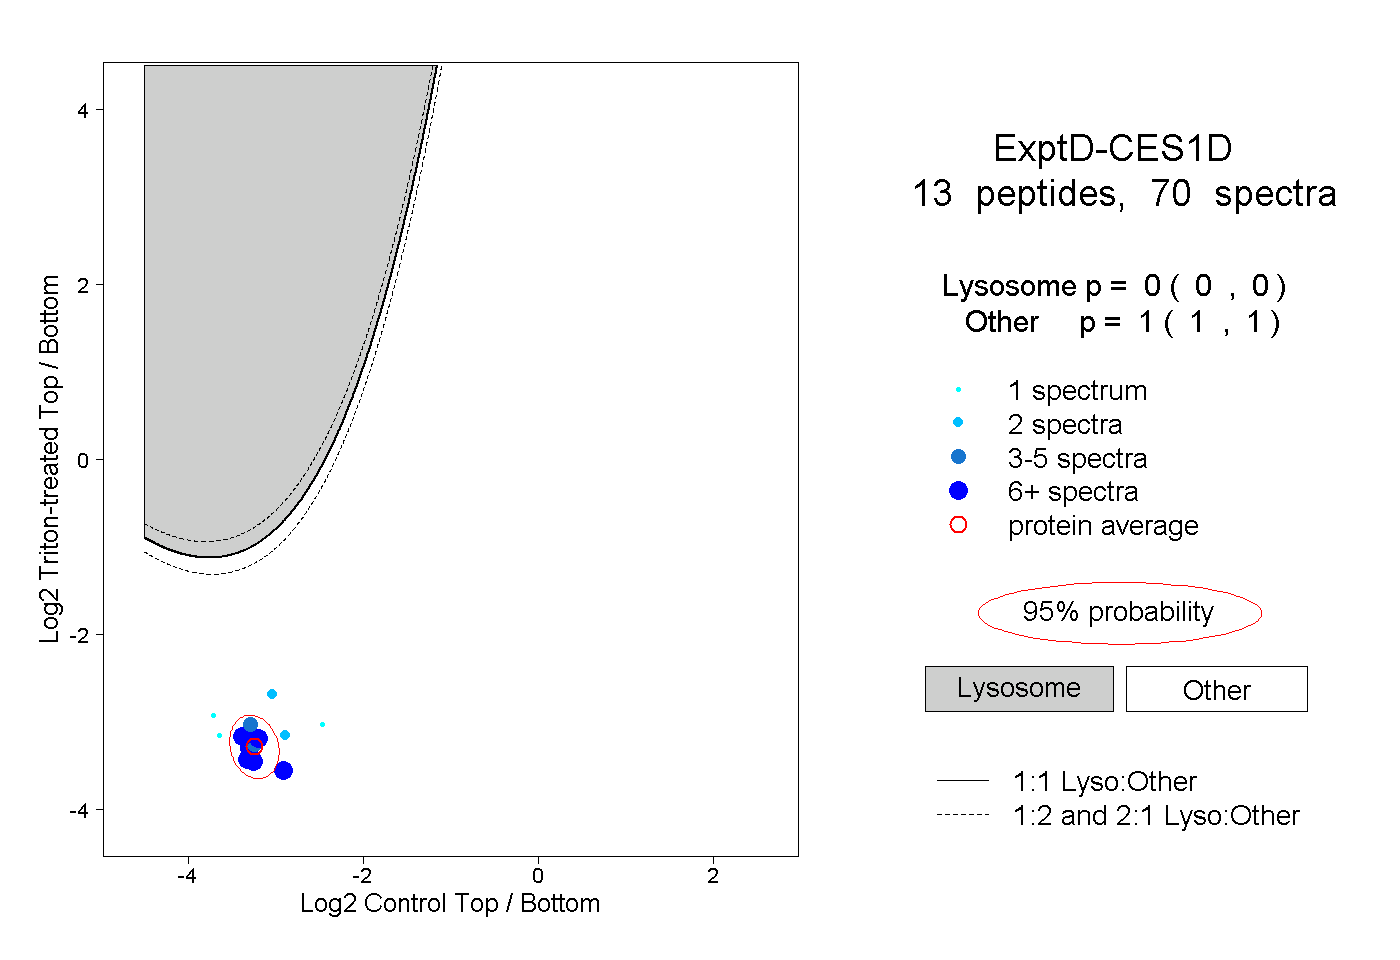
0.000 | 0.000
1.000 | 1.000