 16
16peptides
spectra
0.000 | 0.000
0.060 | 0.062
0.000 | 0.000
0.865 | 0.870
0.069 | 0.072
0.000 | 0.000
0.000 | 0.000
0.000 | 0.000
| Plot | Mito | Lyso | Perox | ER | Golgi | PM | Cytosol | Nucleus | |||||
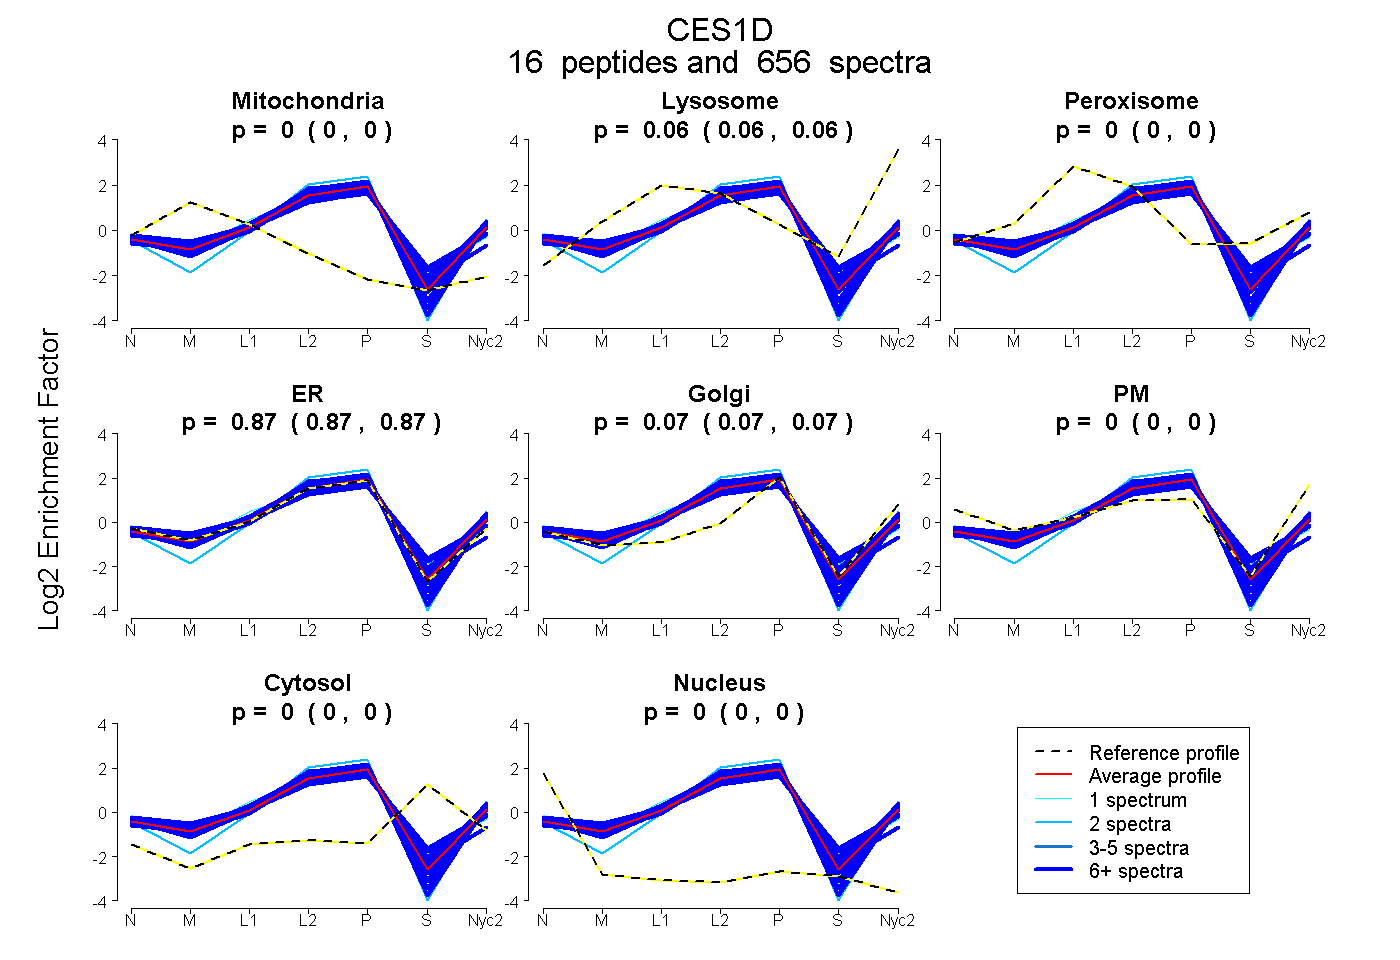
| Expt A |
16 peptides |
656 spectra |
|
0.000 0.000 | 0.000 |
0.062 0.060 | 0.062 |
0.000 0.000 | 0.000 |
0.868 0.865 | 0.870 |
0.071 0.069 | 0.072 |
0.000 0.000 | 0.000 |
0.000 0.000 | 0.000 |
0.000 0.000 | 0.000 |
| 12 spectra, TVIGDHGDELFSVFGSPFLK | 0.000 | 0.091 | 0.000 | 0.825 | 0.045 | 0.000 | 0.039 | 0.000 | ||
| 46 spectra, SYPTLK | 0.000 | 0.022 | 0.000 | 0.948 | 0.000 | 0.030 | 0.000 | 0.000 | ||
| 134 spectra, TTTSAVMVHCLR | 0.000 | 0.000 | 0.140 | 0.710 | 0.091 | 0.000 | 0.059 | 0.000 | ||
| 12 spectra, TEDELLETSLK | 0.000 | 0.056 | 0.000 | 0.907 | 0.000 | 0.037 | 0.000 | 0.000 | ||
| 35 spectra, YFGGTDDPAK | 0.000 | 0.089 | 0.000 | 0.787 | 0.118 | 0.000 | 0.006 | 0.000 | ||
| 2 spectra, ESYPFLPTVIDGVVLPK | 0.000 | 0.000 | 0.000 | 0.959 | 0.041 | 0.000 | 0.000 | 0.000 | ||
| 33 spectra, MIPVVAEK | 0.000 | 0.092 | 0.000 | 0.814 | 0.085 | 0.000 | 0.009 | 0.000 | ||
| 51 spectra, EAAEEPSHWK | 0.059 | 0.000 | 0.007 | 0.910 | 0.000 | 0.000 | 0.023 | 0.000 | ||
| 87 spectra, IGASTQAAQR | 0.000 | 0.009 | 0.000 | 0.950 | 0.000 | 0.041 | 0.000 | 0.000 | ||
| 16 spectra, FAPPQPAEPWNFVK | 0.000 | 0.000 | 0.109 | 0.700 | 0.100 | 0.000 | 0.092 | 0.000 | ||
| 24 spectra, SFNTVPYIVGINK | 0.000 | 0.064 | 0.000 | 0.834 | 0.047 | 0.055 | 0.000 | 0.000 | ||
| 1 spectrum, DAGAPTFMYEFEYRPSFVSAMRPK | 0.000 | 0.000 | 0.100 | 0.854 | 0.000 | 0.000 | 0.045 | 0.000 | ||
| 36 spectra, DGASEEETNLSK | 0.000 | 0.059 | 0.000 | 0.779 | 0.163 | 0.000 | 0.000 | 0.000 | ||
| 77 spectra, YWANFAR | 0.000 | 0.046 | 0.000 | 0.844 | 0.070 | 0.040 | 0.000 | 0.000 | ||
| 55 spectra, TPEEILTEK | 0.000 | 0.092 | 0.000 | 0.798 | 0.091 | 0.000 | 0.020 | 0.000 | ||
| 35 spectra, LDLLGNPK | 0.000 | 0.037 | 0.000 | 0.855 | 0.091 | 0.017 | 0.000 | 0.000 |
| Plot | Mito | Lyso or Perox | ER | Golgi | PM | Cytosol | Nucleus | ||||||
| Expt B |
16 peptides |
262 spectra |
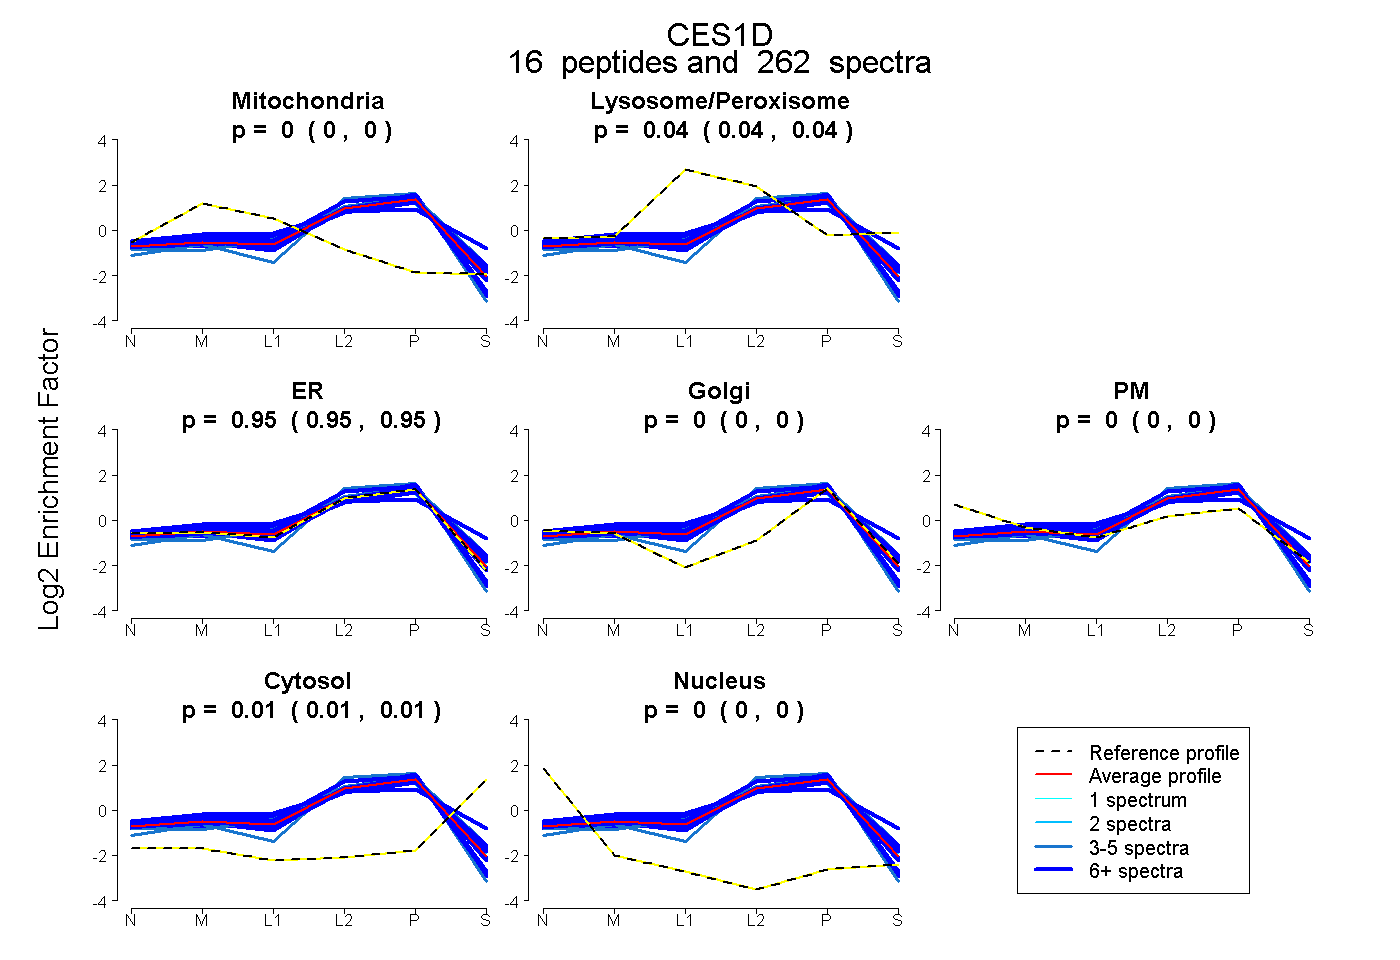 |
0.000 0.000 | 0.000 |
0.040 0.038 | 0.042 |
0.950 0.946 | 0.953 |
0.000 0.000 | 0.000 |
0.000 0.000 | 0.000 |
0.010 0.009 | 0.012 |
0.000 0.000 | 0.000 |
|||
| Plot | Lyso | Other | |||||||||||
| Expt C |
15 peptides |
782 spectra |
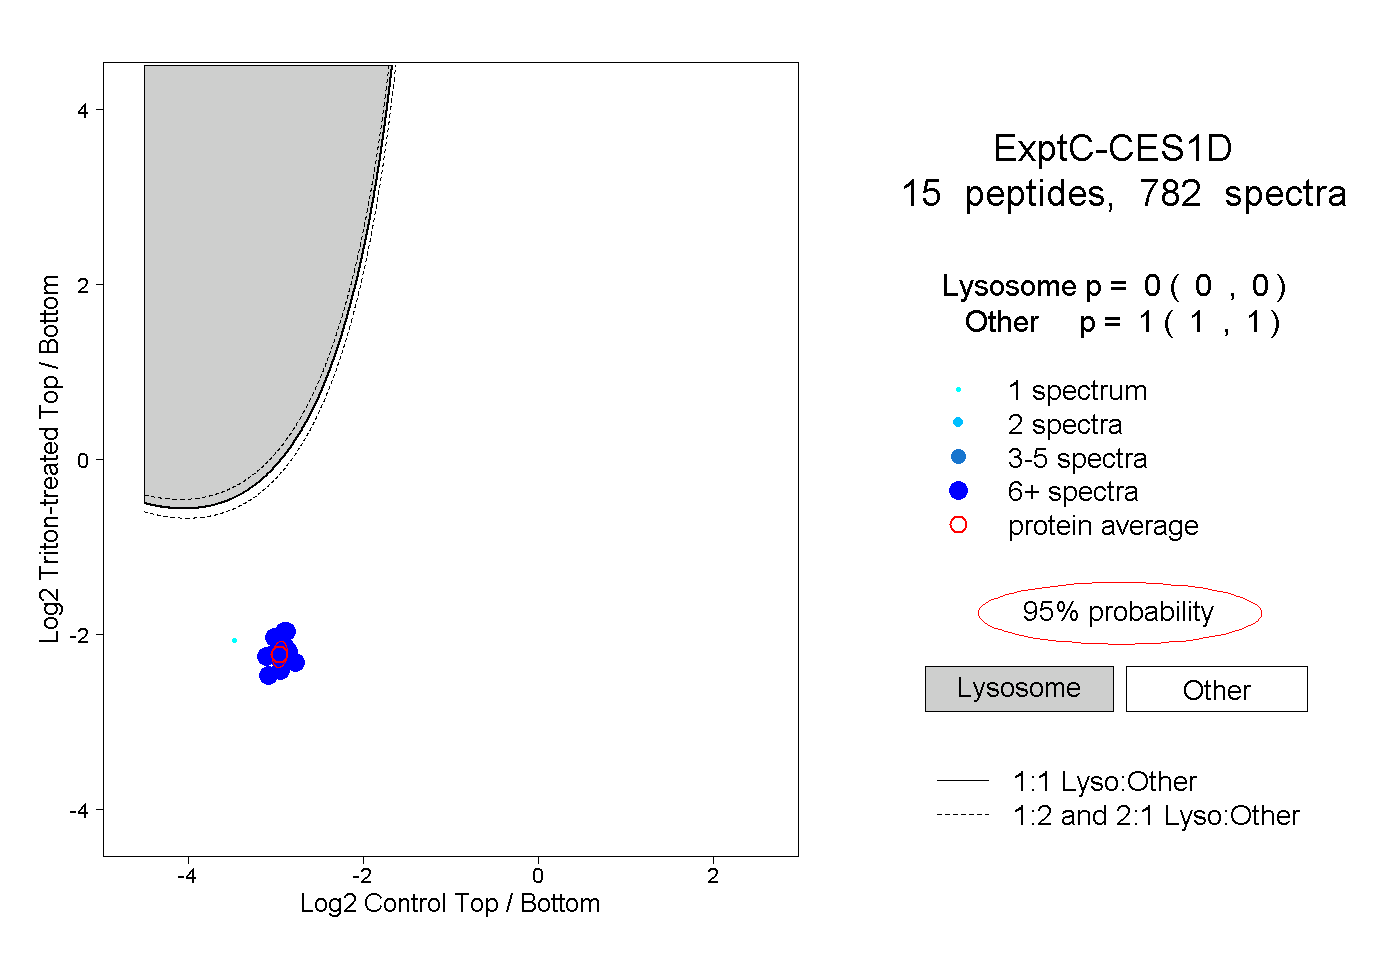 |
0.000 0.000 | 0.000 |
1.000 1.000 | 1.000 |
||||||||
| Plot | Lyso | Other | |||||||||||
| Expt D |
13 peptides |
70 spectra |
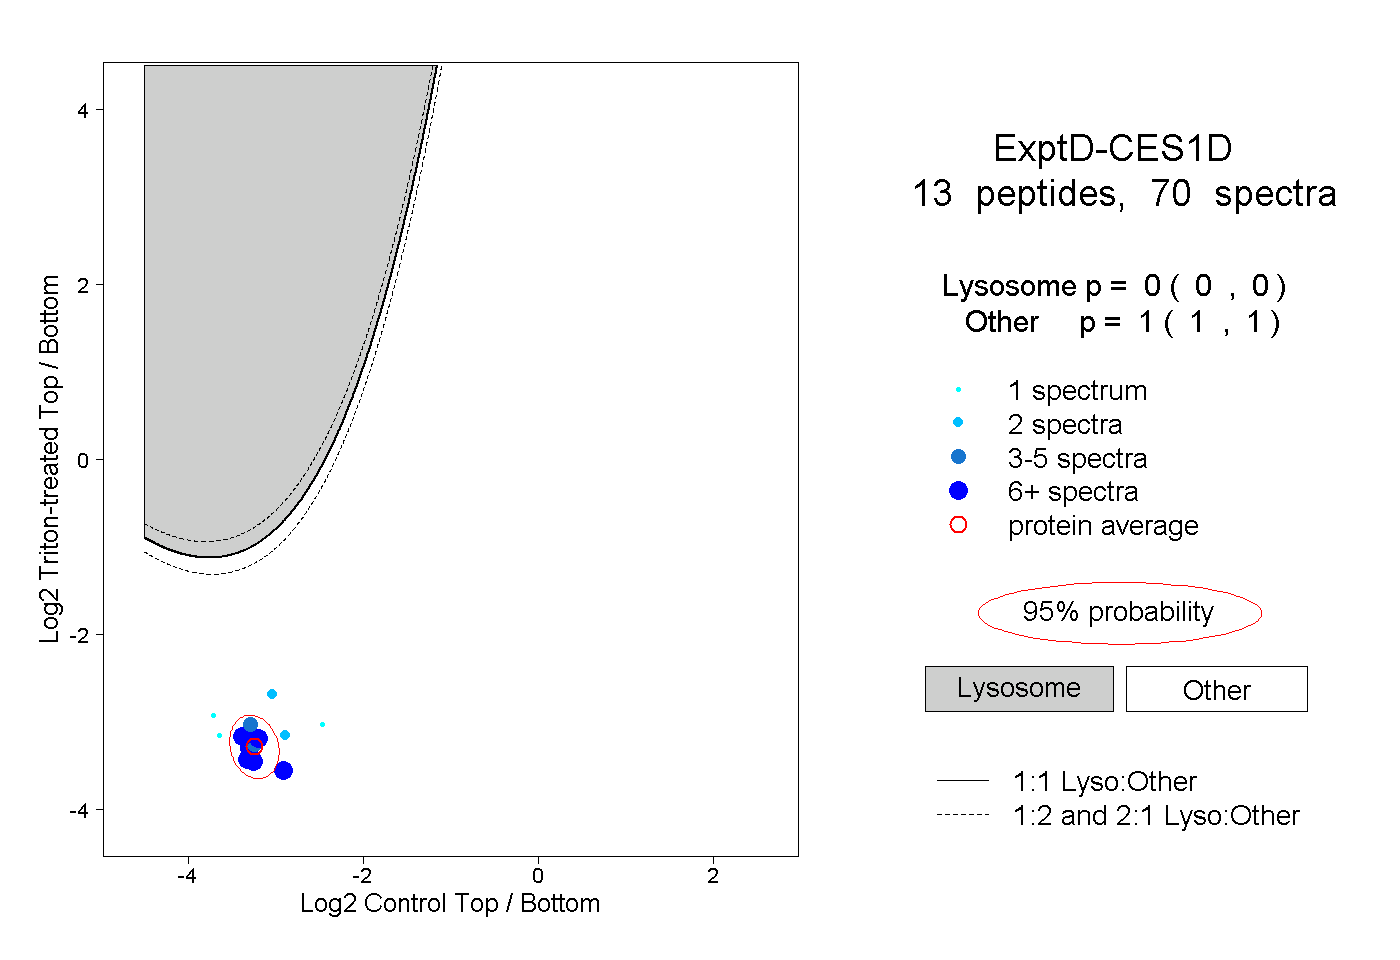 |
0.000 0.000 | 0.000 |
1.000 1.000 | 1.000 |