9
9peptides
spectra
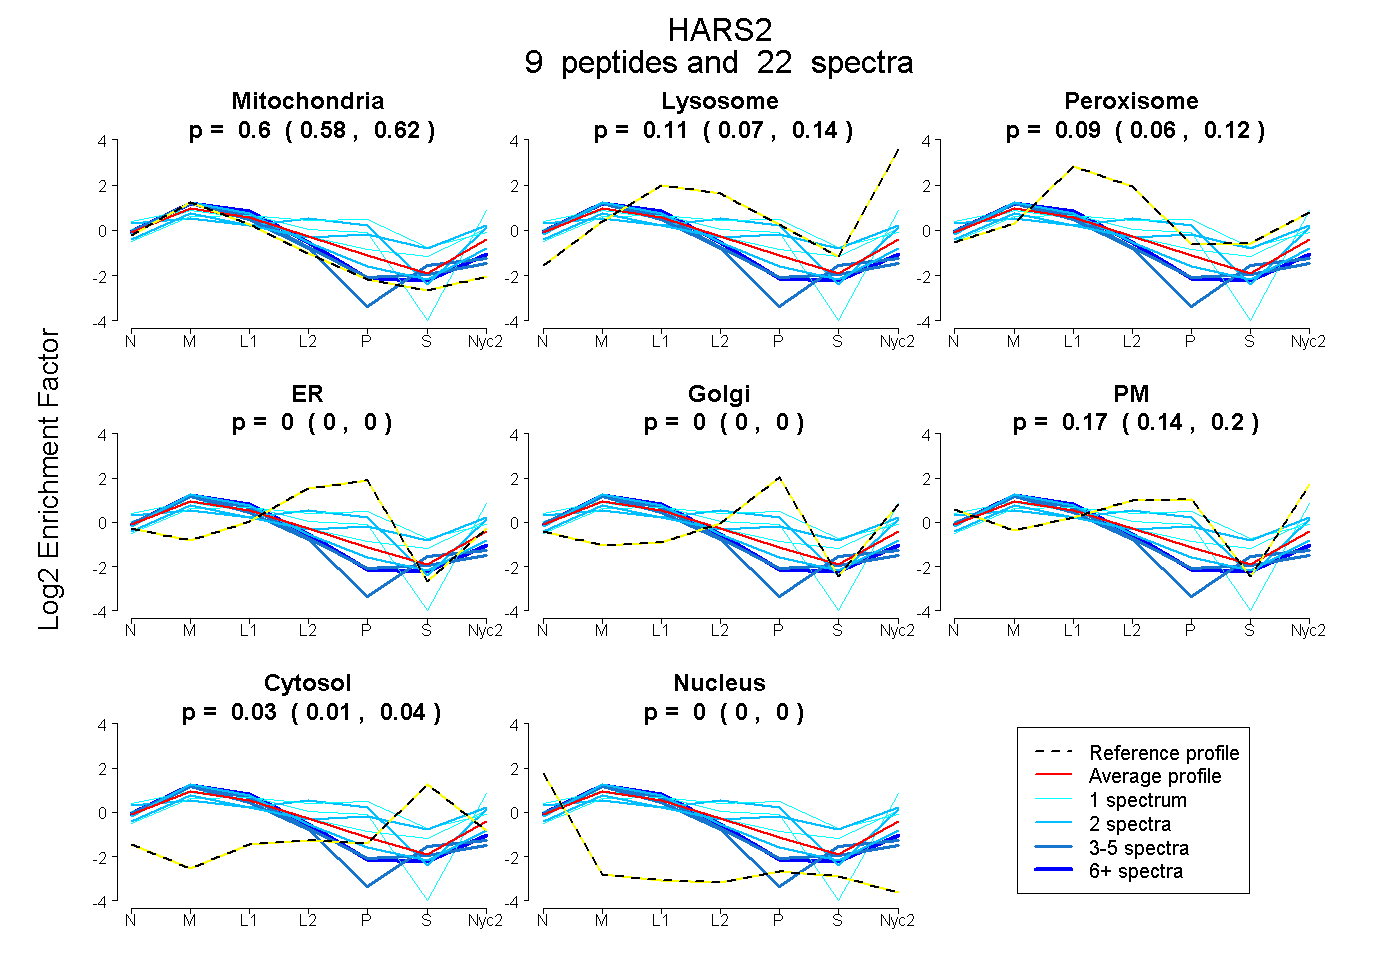
0.577 | 0.621
0.074 | 0.138
0.056 | 0.116
0.000 | 0.000
0.000 | 0.000
0.138 | 0.203
0.015 | 0.039
0.000 | 0.000
5peptides
spectra
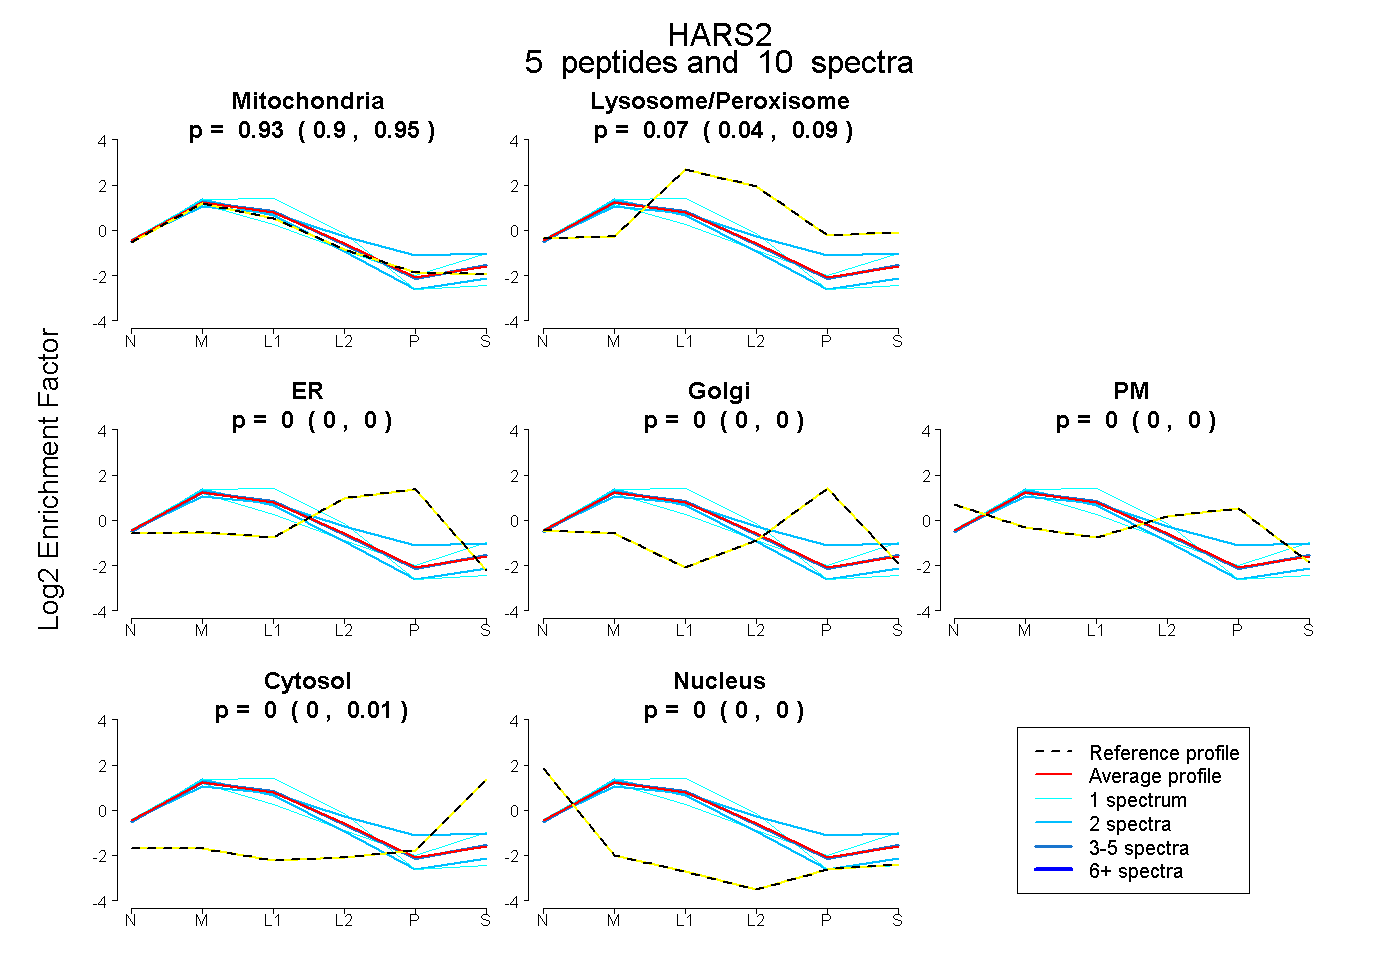
0.898 | 0.951
0.044 | 0.090
0.000 | 0.000
0.000 | 0.000
0.000 | 0.000
0.000 | 0.013
0.000 | 0.000
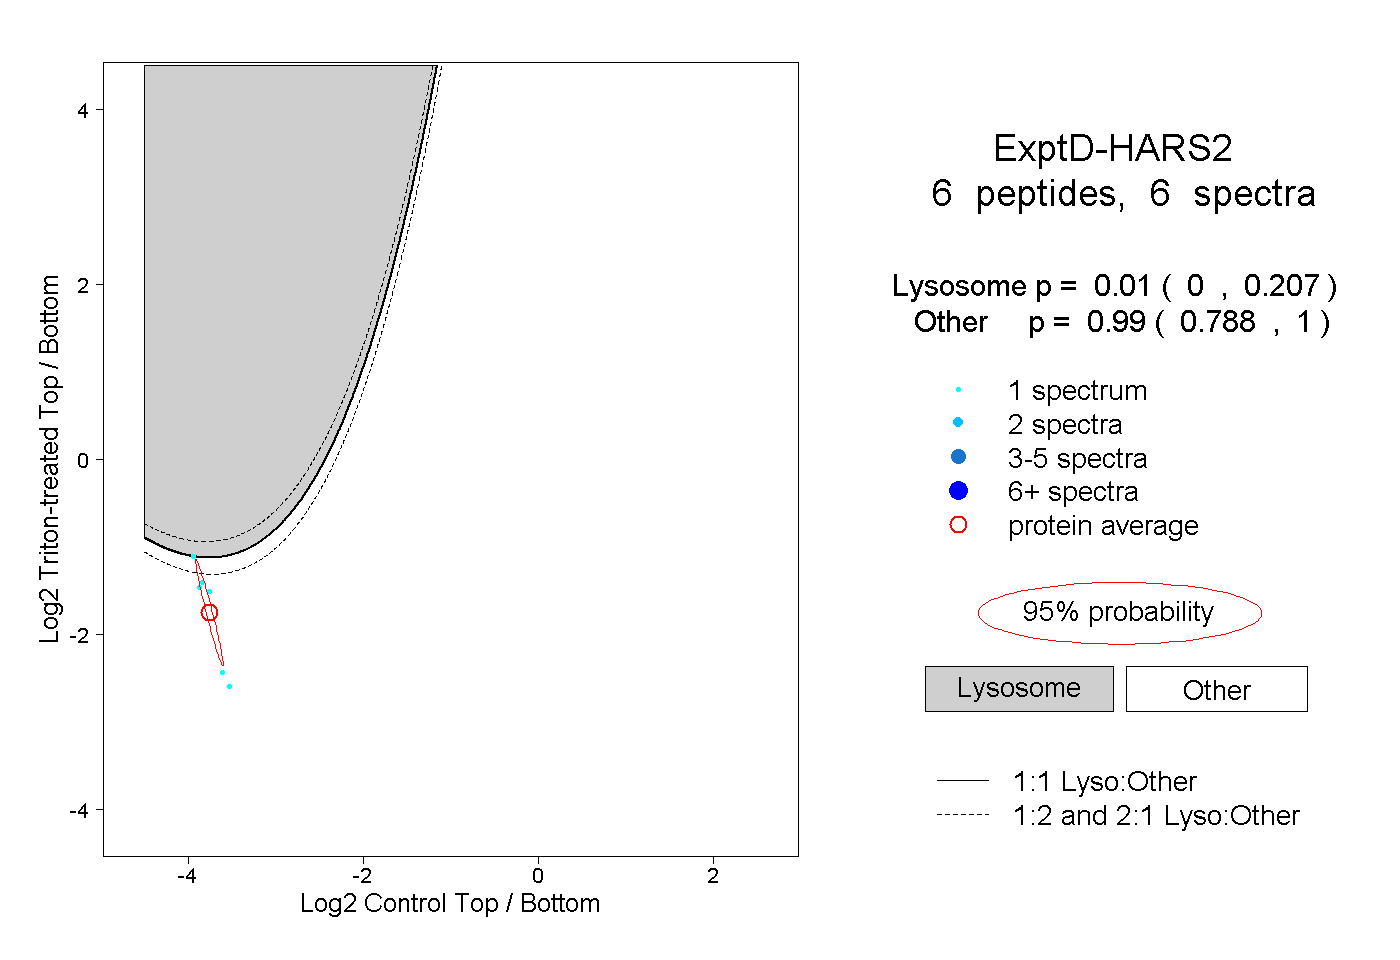
17peptides
spectra
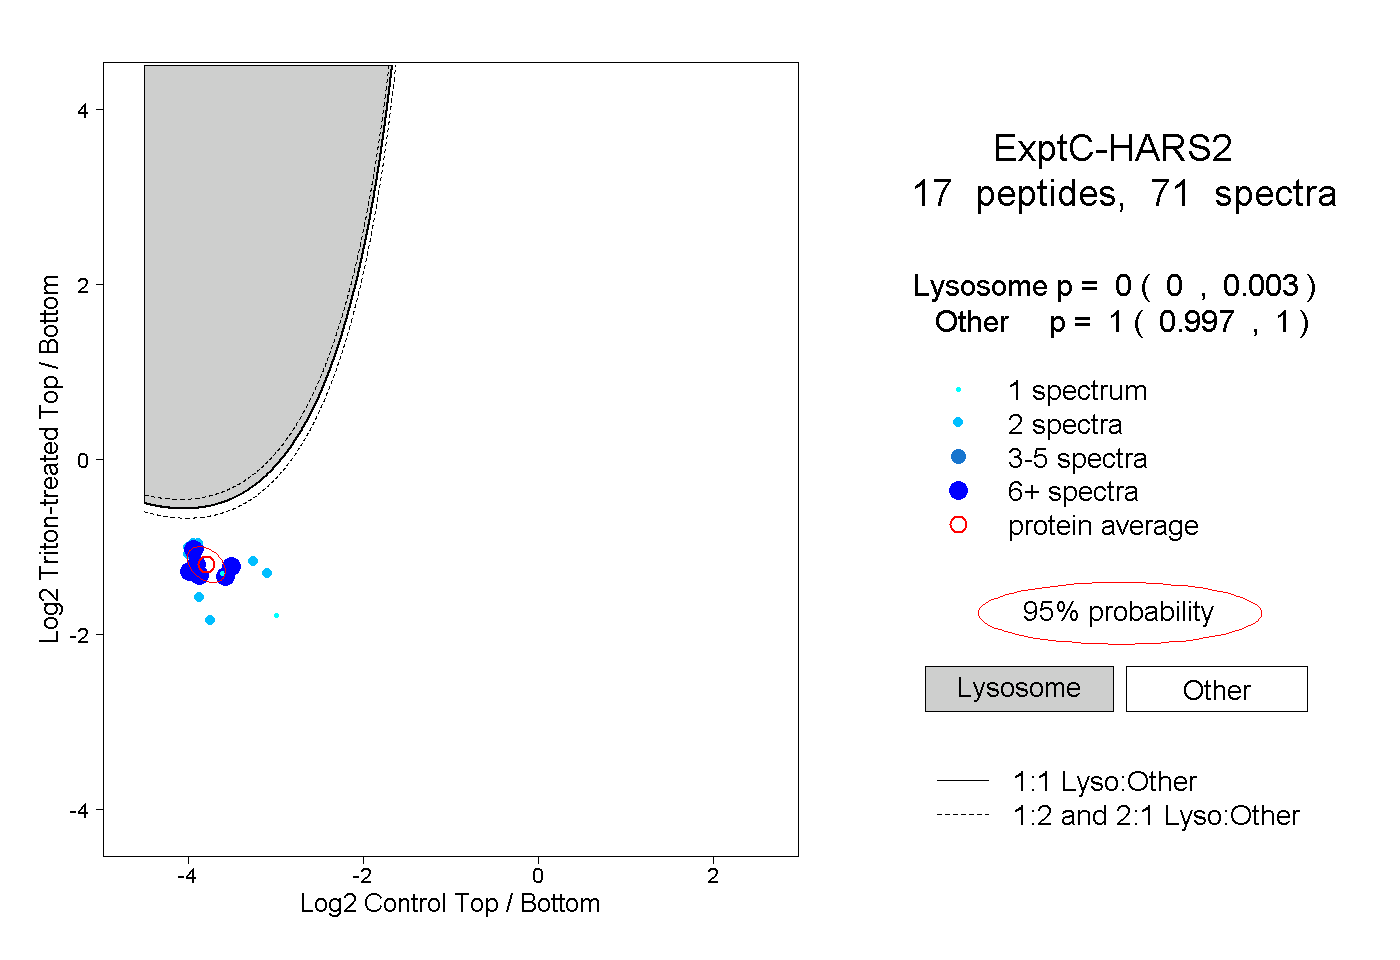
0.000 | 0.003
0.997 | 1.000