 9
9peptides
spectra
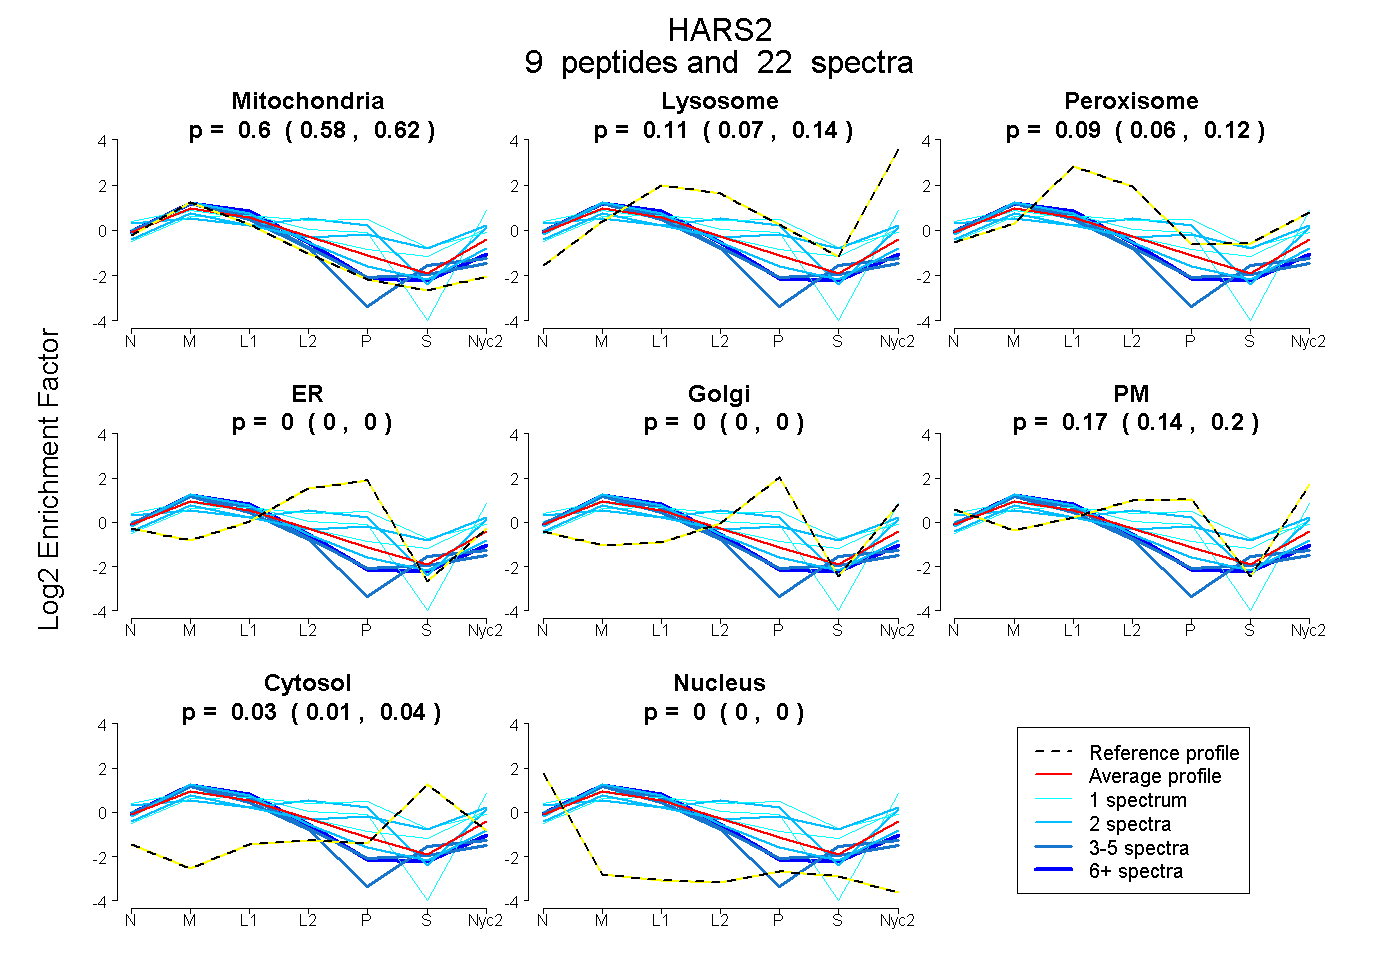
0.577 | 0.621
0.074 | 0.138
0.056 | 0.116
0.000 | 0.000
0.000 | 0.000
0.138 | 0.203
0.015 | 0.039
0.000 | 0.000
| Plot | Mito | Lyso | Perox | ER | Golgi | PM | Cytosol | Nucleus | |||||
| Expt A |
9 peptides |
22 spectra |
|
0.601 0.577 | 0.621 |
0.108 0.074 | 0.138 |
0.088 0.056 | 0.116 |
0.000 0.000 | 0.000 |
0.000 0.000 | 0.000 |
0.174 0.138 | 0.203 |
0.028 0.015 | 0.039 |
0.000 0.000 | 0.000 |
| 2 spectra, GHSVPCVGLSIGVER | 0.331 | 0.000 | 0.026 | 0.135 | 0.000 | 0.508 | 0.000 | 0.000 | ||
| 1 spectrum, ESLVAEIQK | 0.355 | 0.000 | 0.000 | 0.000 | 0.000 | 0.645 | 0.000 | 0.000 | ||
| 4 spectra, ETLNVGSVAAGGR | 0.813 | 0.000 | 0.152 | 0.000 | 0.000 | 0.000 | 0.035 | 0.000 | ||
| 2 spectra, MSWEDVR | 0.761 | 0.149 | 0.060 | 0.000 | 0.000 | 0.031 | 0.000 | 0.000 | ||
| 1 spectrum, EEVTVNR | 0.452 | 0.148 | 0.116 | 0.000 | 0.000 | 0.175 | 0.109 | 0.000 | ||
| 6 spectra, DLSPQQMVVR | 0.795 | 0.058 | 0.147 | 0.000 | 0.000 | 0.000 | 0.000 | 0.000 | ||
| 1 spectrum, GLDYYTGVIYEAVLLESPAQAGK | 0.175 | 0.000 | 0.423 | 0.000 | 0.326 | 0.000 | 0.075 | 0.000 | ||
| 2 spectra, TTETQVFVATPQK | 0.351 | 0.237 | 0.072 | 0.000 | 0.175 | 0.007 | 0.158 | 0.000 | ||
| 3 spectra, LLFEYLR | 0.825 | 0.000 | 0.094 | 0.000 | 0.000 | 0.000 | 0.081 | 0.000 |
| Plot | Mito | Lyso or Perox | ER | Golgi | PM | Cytosol | Nucleus | ||||||
| Expt B |
5 peptides |
10 spectra |
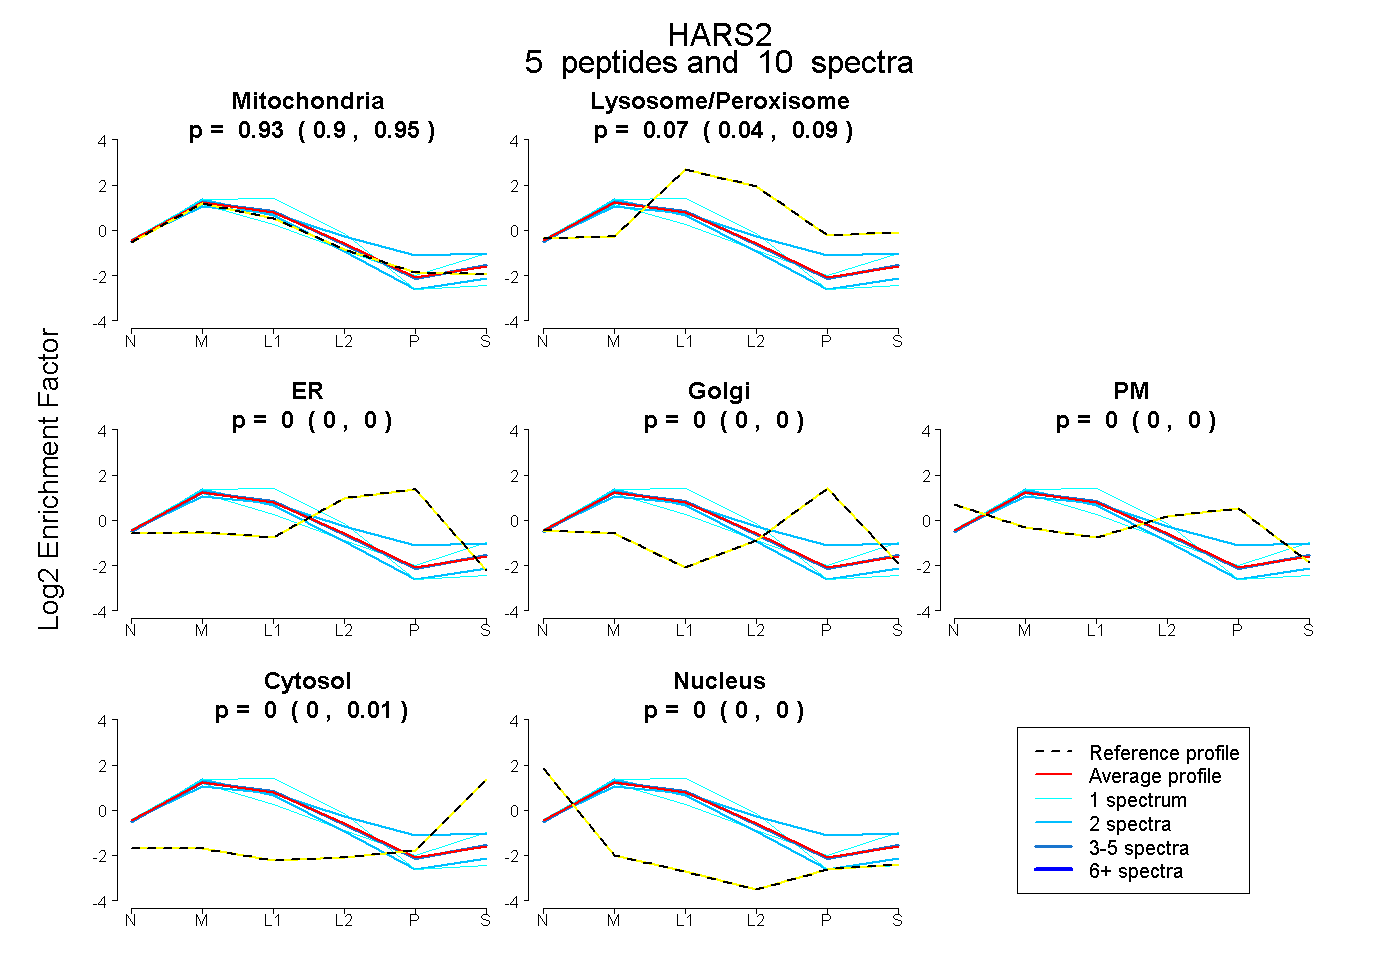 |
0.931 0.898 | 0.951 |
0.069 0.044 | 0.090 |
0.000 0.000 | 0.000 |
0.000 0.000 | 0.000 |
0.000 0.000 | 0.000 |
0.000 0.000 | 0.013 |
0.000 0.000 | 0.000 |
|||
| Plot | Lyso | Other | |||||||||||
| Expt C |
17 peptides |
71 spectra |
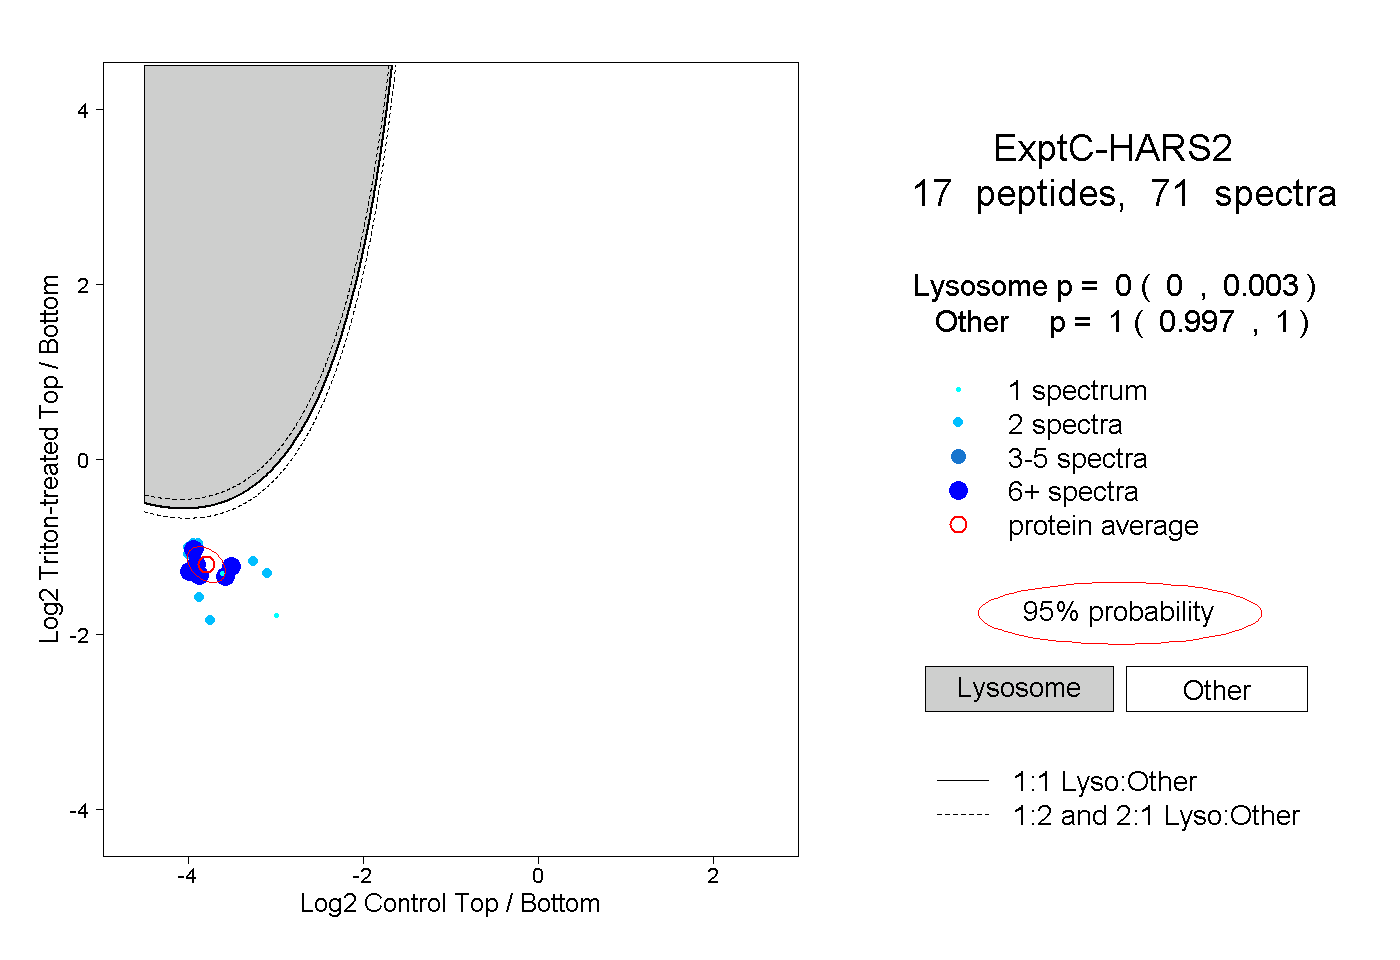 |
0.000 0.000 | 0.003 |
1.000 0.997 | 1.000 |
||||||||
| Plot | Lyso | Other | |||||||||||
| Expt D |
6 peptides |
6 spectra |
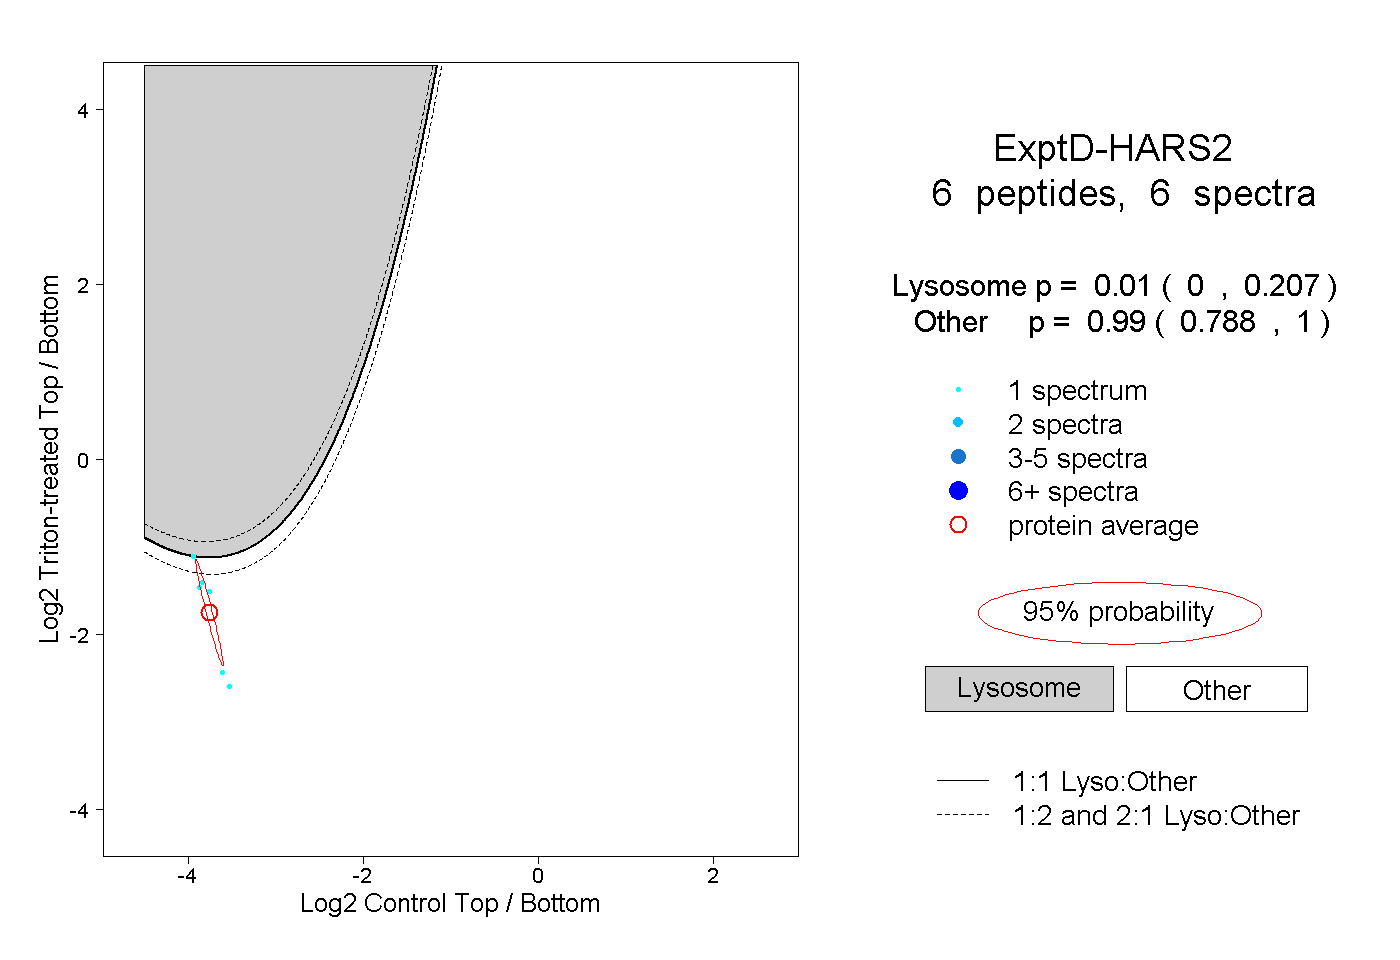 |
0.010 0.000 | 0.207 |
0.990 0.788 | 1.000 |