 11
11peptides
spectra
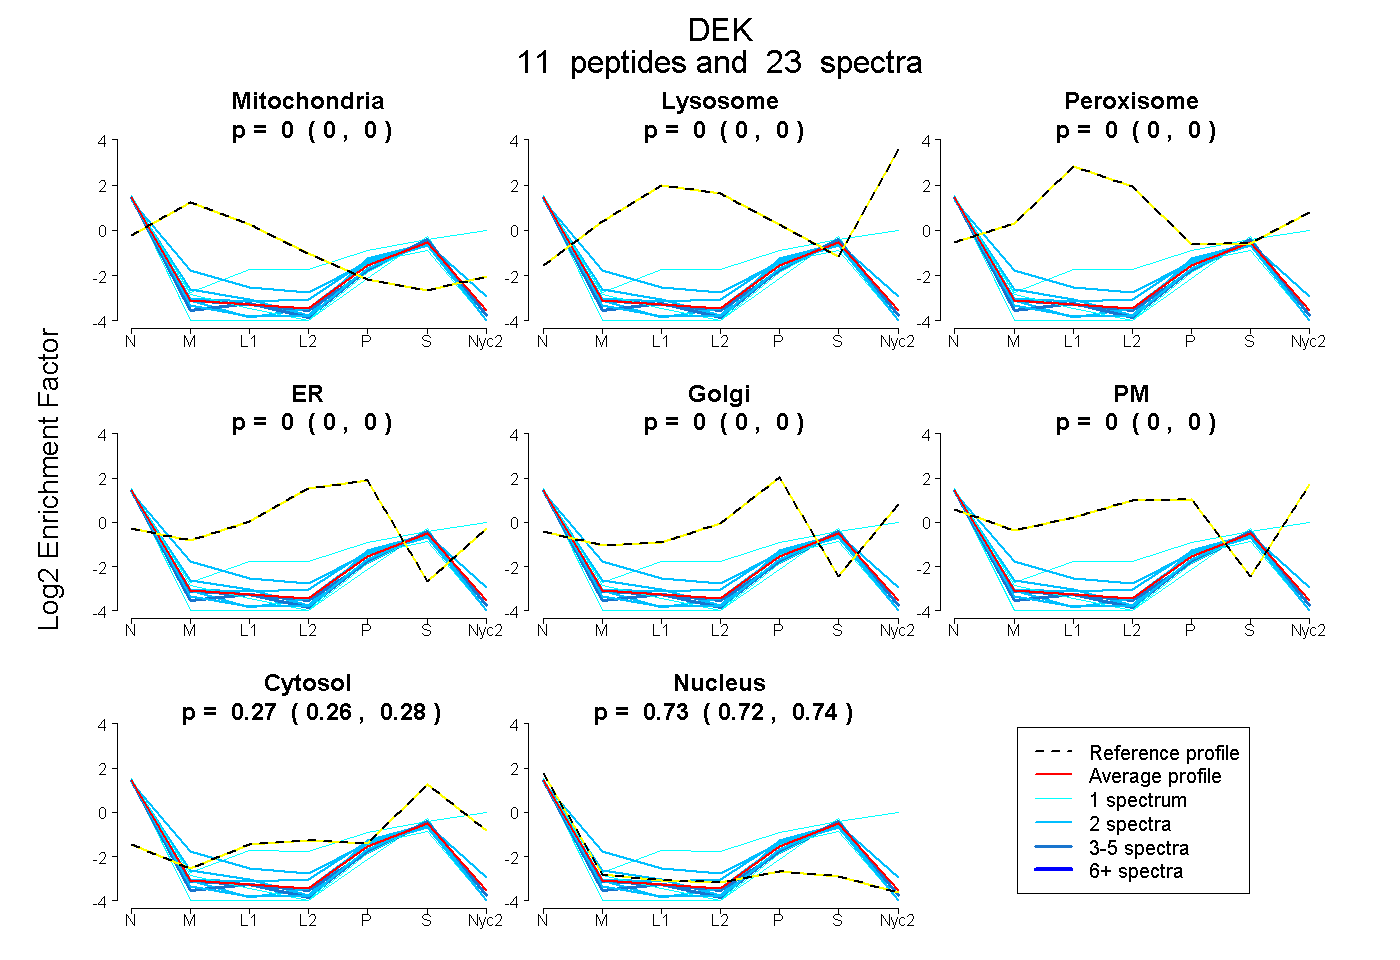
0.000 | 0.000
0.000 | 0.000
0.000 | 0.000
0.000 | 0.000
0.000 | 0.000
0.000 | 0.000
0.260 | 0.278
0.720 | 0.739
| Plot | Mito | Lyso | Perox | ER | Golgi | PM | Cytosol | Nucleus | |||||
| Expt A |
11 peptides |
23 spectra |
|
0.000 0.000 | 0.000 |
0.000 0.000 | 0.000 |
0.000 0.000 | 0.000 |
0.000 0.000 | 0.000 |
0.000 0.000 | 0.000 |
0.000 0.000 | 0.000 |
0.270 0.260 | 0.278 |
0.730 0.720 | 0.739 |
| 5 spectra, LTMQVSSLQR | 0.000 | 0.000 | 0.000 | 0.000 | 0.000 | 0.000 | 0.242 | 0.758 | ||
| 4 spectra, IHFFLSK | 0.000 | 0.000 | 0.000 | 0.000 | 0.000 | 0.000 | 0.250 | 0.750 | ||
| 2 spectra, SGVNSELVK | 0.048 | 0.000 | 0.000 | 0.000 | 0.000 | 0.000 | 0.282 | 0.671 | ||
| 2 spectra, LCEIER | 0.000 | 0.000 | 0.000 | 0.000 | 0.000 | 0.000 | 0.264 | 0.736 | ||
| 1 spectrum, EVYENYPAYDLTER | 0.000 | 0.000 | 0.000 | 0.000 | 0.000 | 0.000 | 0.189 | 0.811 | ||
| 2 spectra, GSTQYK | 0.000 | 0.000 | 0.000 | 0.000 | 0.000 | 0.000 | 0.314 | 0.686 | ||
| 2 spectra, SICEVLDLER | 0.000 | 0.000 | 0.000 | 0.000 | 0.000 | 0.000 | 0.197 | 0.803 | ||
| 1 spectrum, NVGQFSGFPFEK | 0.000 | 0.000 | 0.000 | 0.000 | 0.000 | 0.000 | 0.172 | 0.828 | ||
| 1 spectrum, EPFTIAQGK | 0.000 | 0.000 | 0.000 | 0.000 | 0.000 | 0.275 | 0.424 | 0.301 | ||
| 2 spectra, LLYNRPGTVSSLK | 0.000 | 0.000 | 0.000 | 0.000 | 0.000 | 0.000 | 0.202 | 0.798 | ||
| 1 spectrum, LLADANLEEVTMK | 0.000 | 0.000 | 0.000 | 0.000 | 0.000 | 0.000 | 0.174 | 0.826 |
| Plot | Mito | Lyso or Perox | ER | Golgi | PM | Cytosol | Nucleus | ||||||
| Expt B |
1 peptide |
1 spectrum |
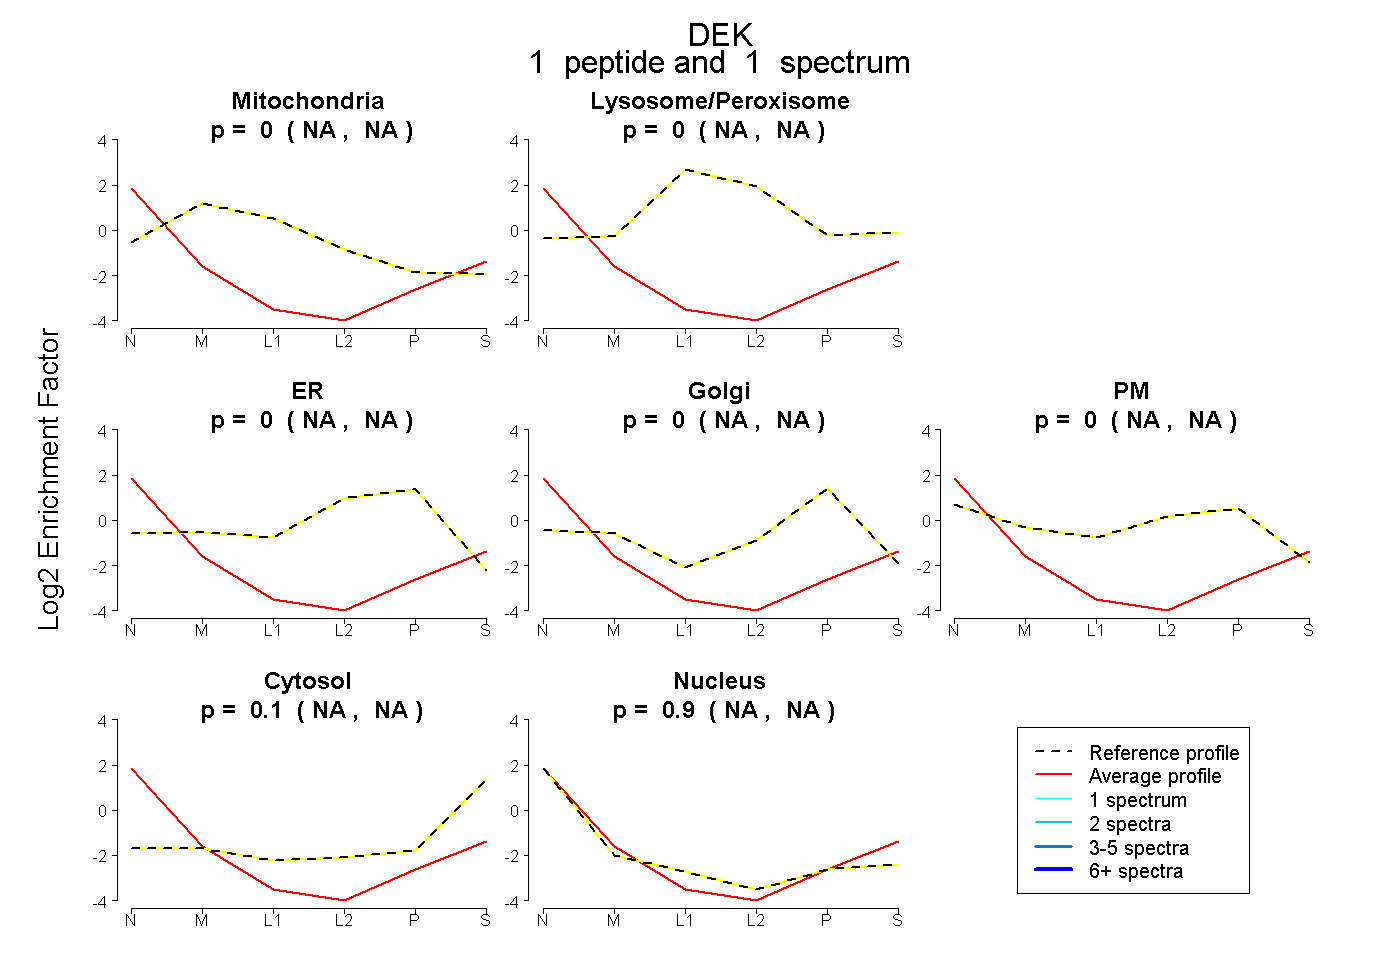 |
0.000 NA | NA |
0.000 NA | NA |
0.000 NA | NA |
0.000 NA | NA |
0.000 NA | NA |
0.096 NA | NA |
0.904 NA | NA |