 3
3peptides
spectra
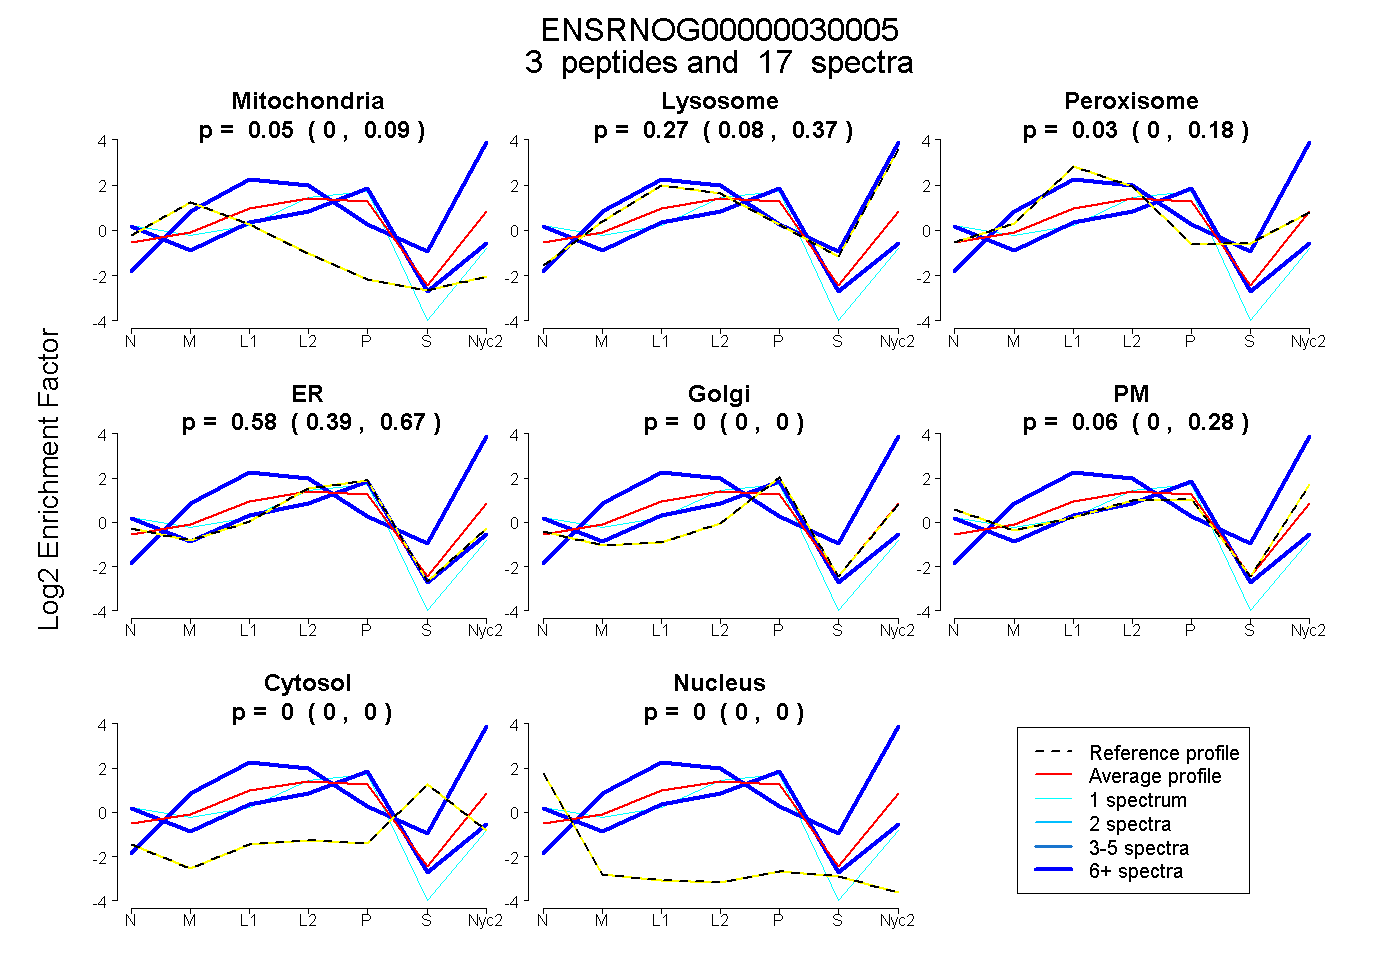
0.000 | 0.092
0.078 | 0.365
0.000 | 0.178
0.388 | 0.672
0.000 | 0.000
0.000 | 0.277
0.000 | 0.000
0.000 | 0.000
1peptide
spectra
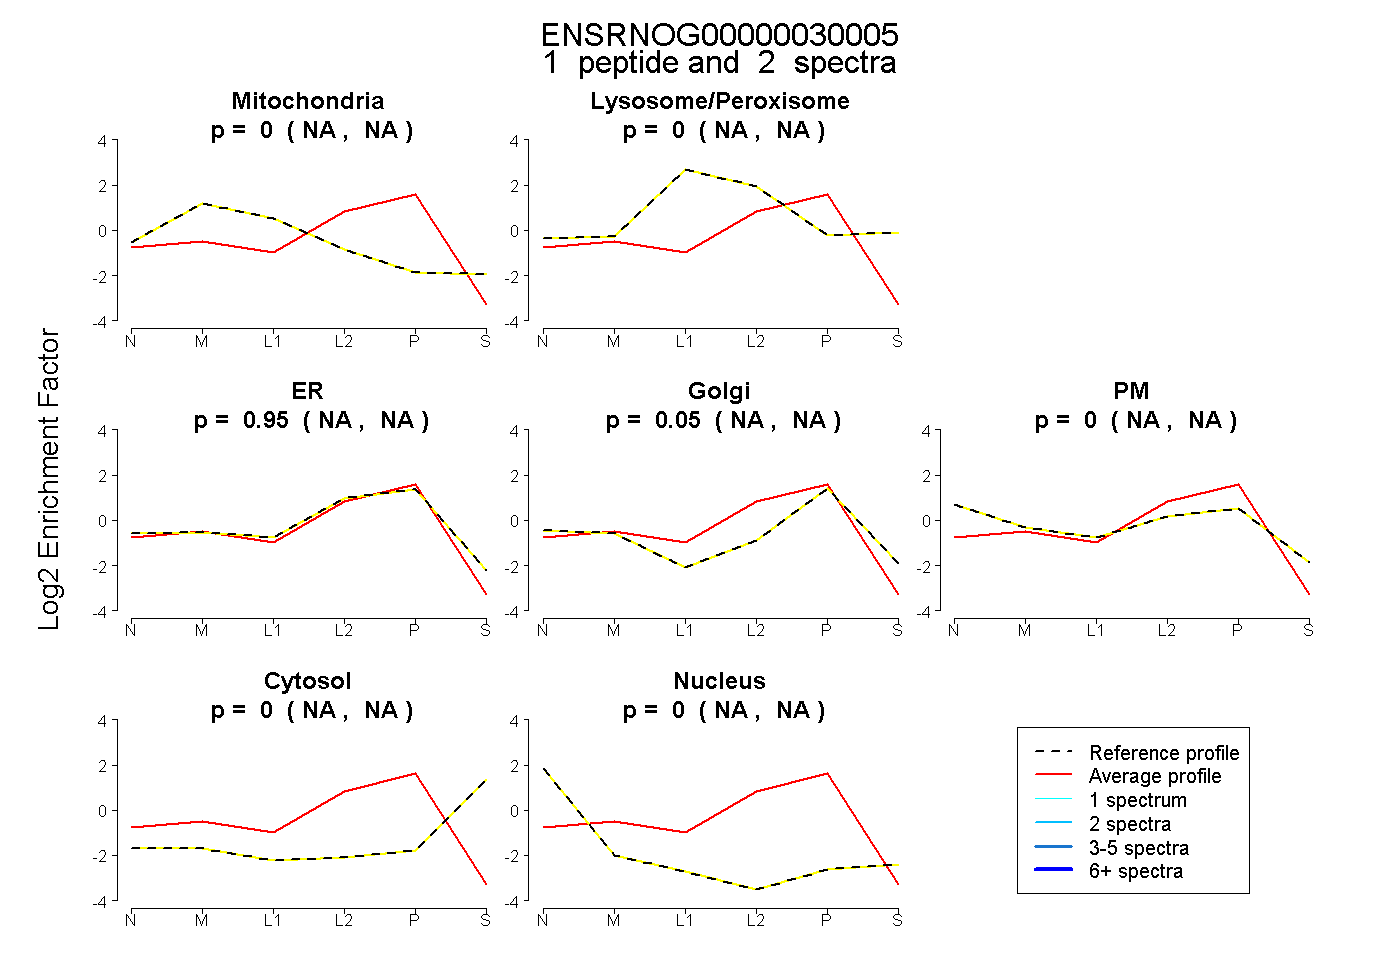
NA | NA
NA | NA
NA | NA
NA | NA
NA | NA
NA | NA
NA | NA
3peptides
spectra
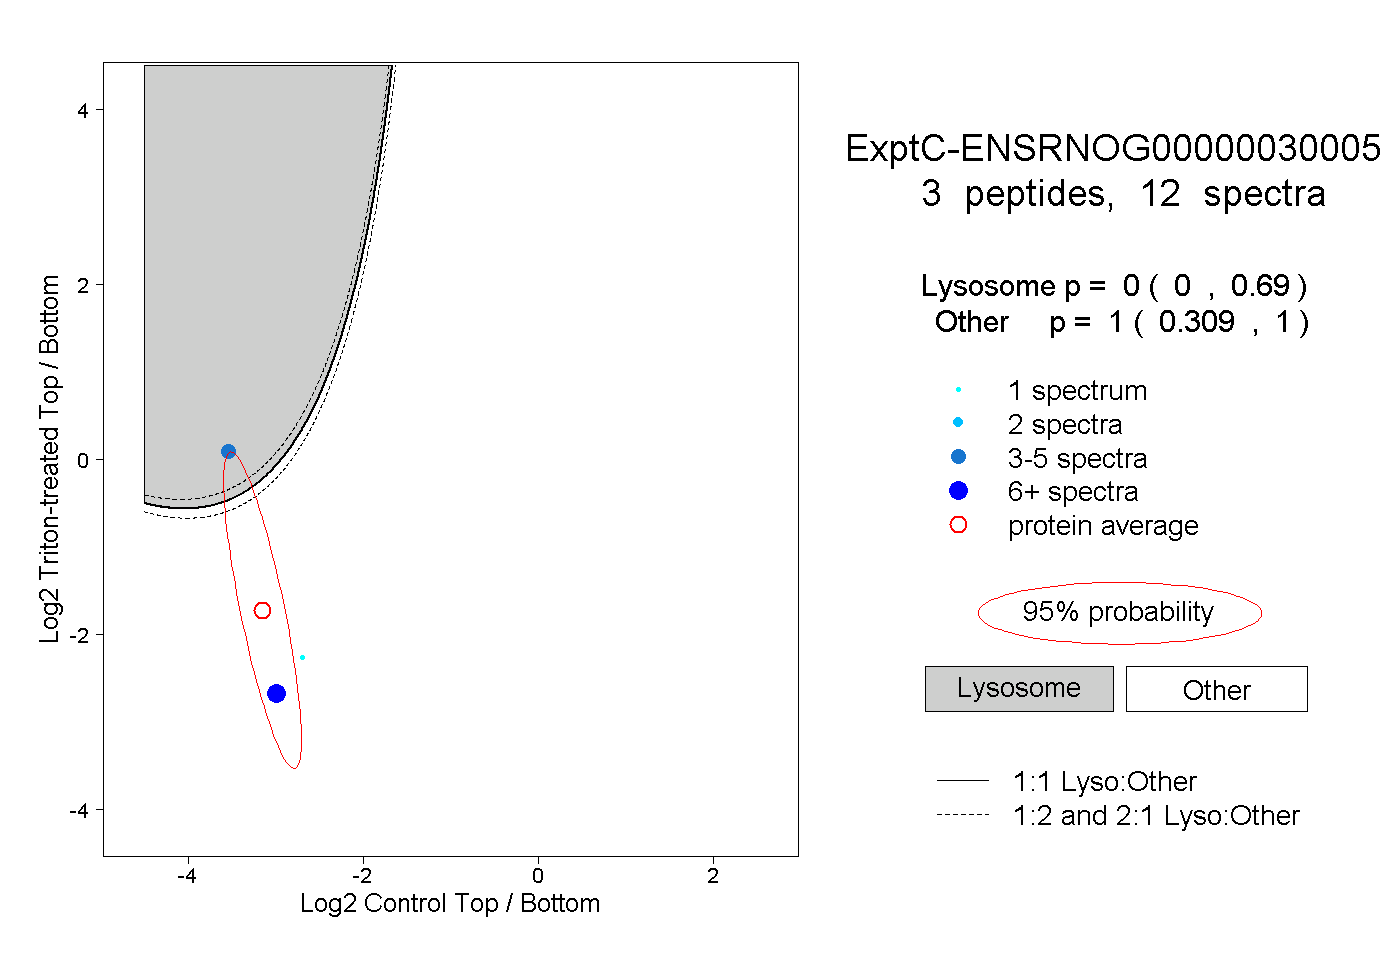
0.000 | 0.690
0.309 | 1.000