 6
6peptides
spectra
0.000 | 0.000
0.968 | 0.990
0.000 | 0.000
0.000 | 0.000
0.000 | 0.006
0.000 | 0.008
0.005 | 0.028
0.000 | 0.000
| Plot | Mito | Lyso | Perox | ER | Golgi | PM | Cytosol | Nucleus | |||||
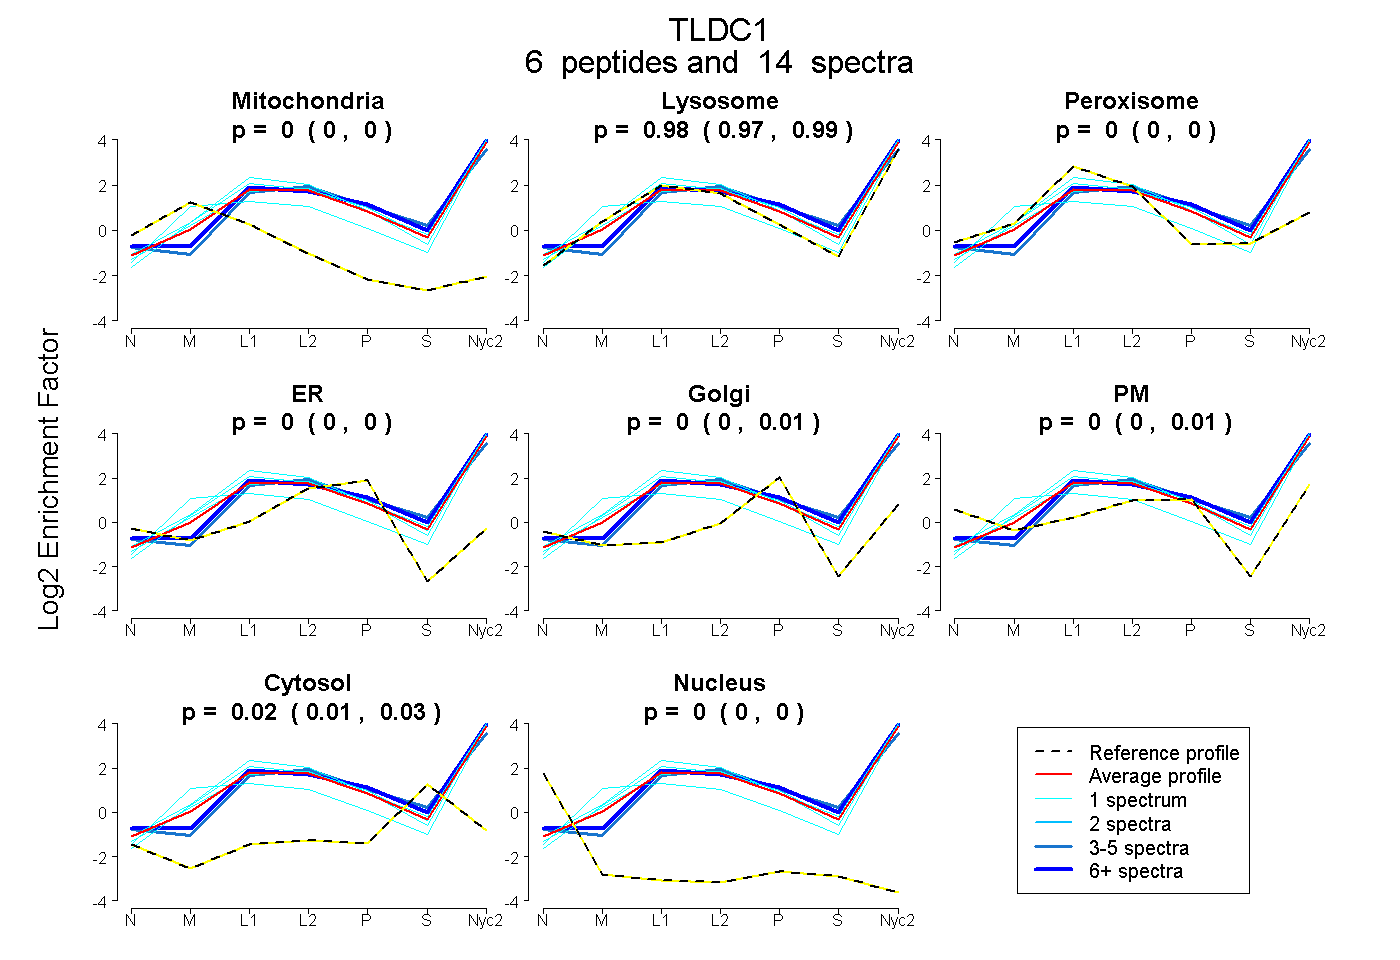
| Expt A |
6 peptides |
14 spectra |
|
0.000 0.000 | 0.000 |
0.981 0.968 | 0.990 |
0.000 0.000 | 0.000 |
0.000 0.000 | 0.000 |
0.000 0.000 | 0.006 |
0.000 0.000 | 0.008 |
0.019 0.005 | 0.028 |
0.000 0.000 | 0.000 |
| 1 spectrum, MISVAEGPTK | 0.031 | 0.967 | 0.000 | 0.000 | 0.000 | 0.000 | 0.002 | 0.000 | ||
| 4 spectra, CFLFSIAPR | 0.000 | 0.867 | 0.000 | 0.000 | 0.000 | 0.025 | 0.108 | 0.000 | ||
| 1 spectrum, LYNGMWR | 0.000 | 0.995 | 0.000 | 0.000 | 0.000 | 0.000 | 0.005 | 0.000 | ||
| 6 spectra, EALPPAMVAR | 0.000 | 0.921 | 0.000 | 0.000 | 0.000 | 0.036 | 0.043 | 0.000 | ||
| 1 spectrum, SLSGQK | 0.000 | 1.000 | 0.000 | 0.000 | 0.000 | 0.000 | 0.000 | 0.000 | ||
| 1 spectrum, EQFTVFLSHLLK | 0.000 | 1.000 | 0.000 | 0.000 | 0.000 | 0.000 | 0.000 | 0.000 |
| Plot | Mito | Lyso or Perox | ER | Golgi | PM | Cytosol | Nucleus | ||||||
| Expt B |
2 peptides |
3 spectra |
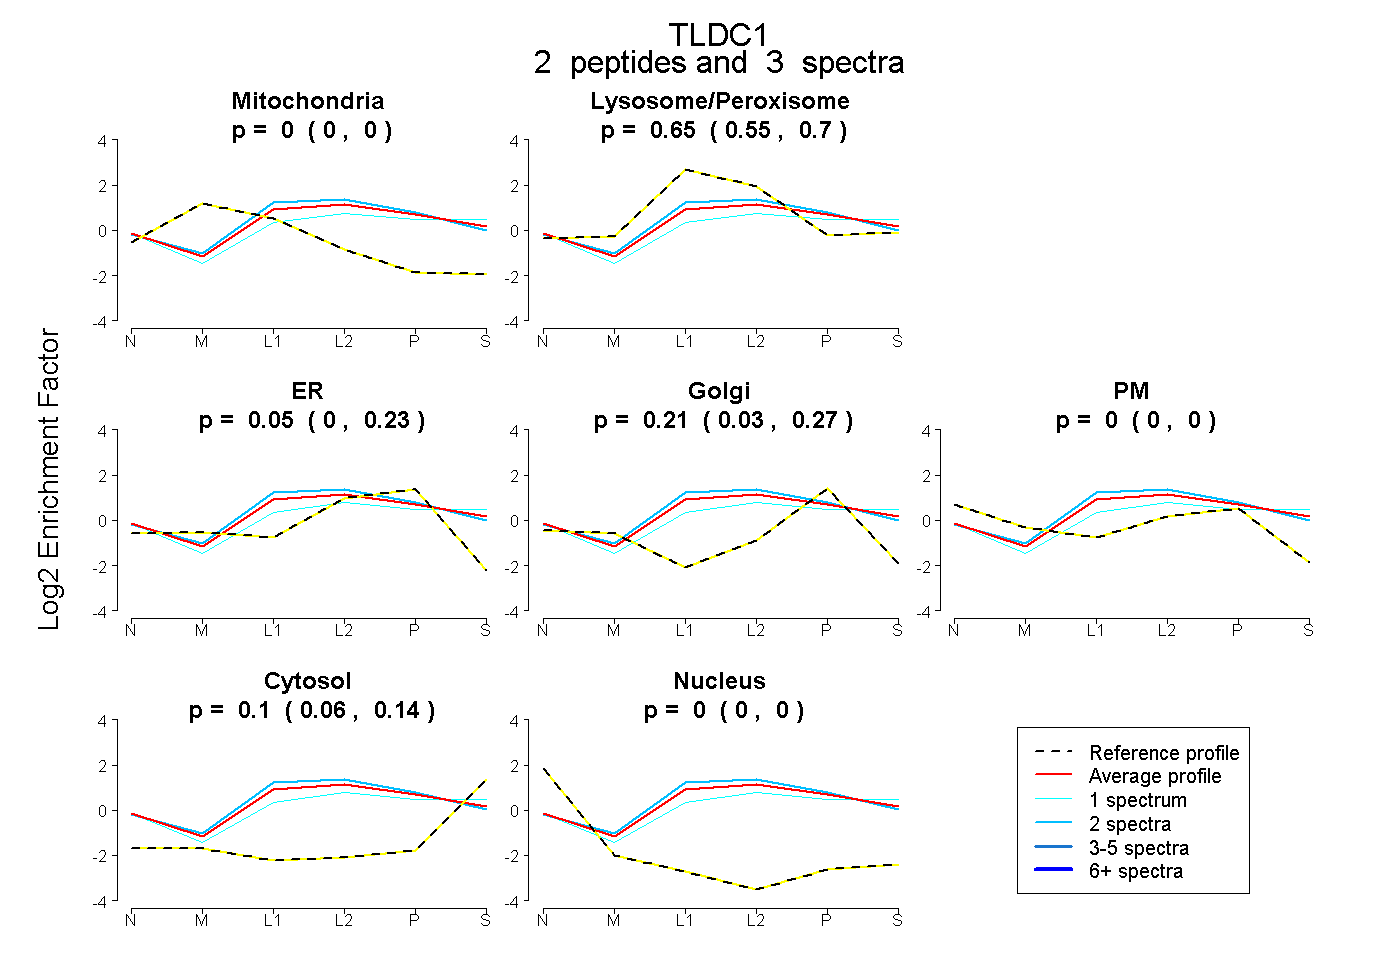 |
0.000 0.000 | 0.000 |
0.645 0.548 | 0.698 |
0.045 0.000 | 0.229 |
0.213 0.029 | 0.269 |
0.000 0.000 | 0.000 |
0.097 0.058 | 0.145 |
0.000 0.000 | 0.000 |
|||
| Plot | Lyso | Other | |||||||||||
| Expt C |
12 peptides |
46 spectra |
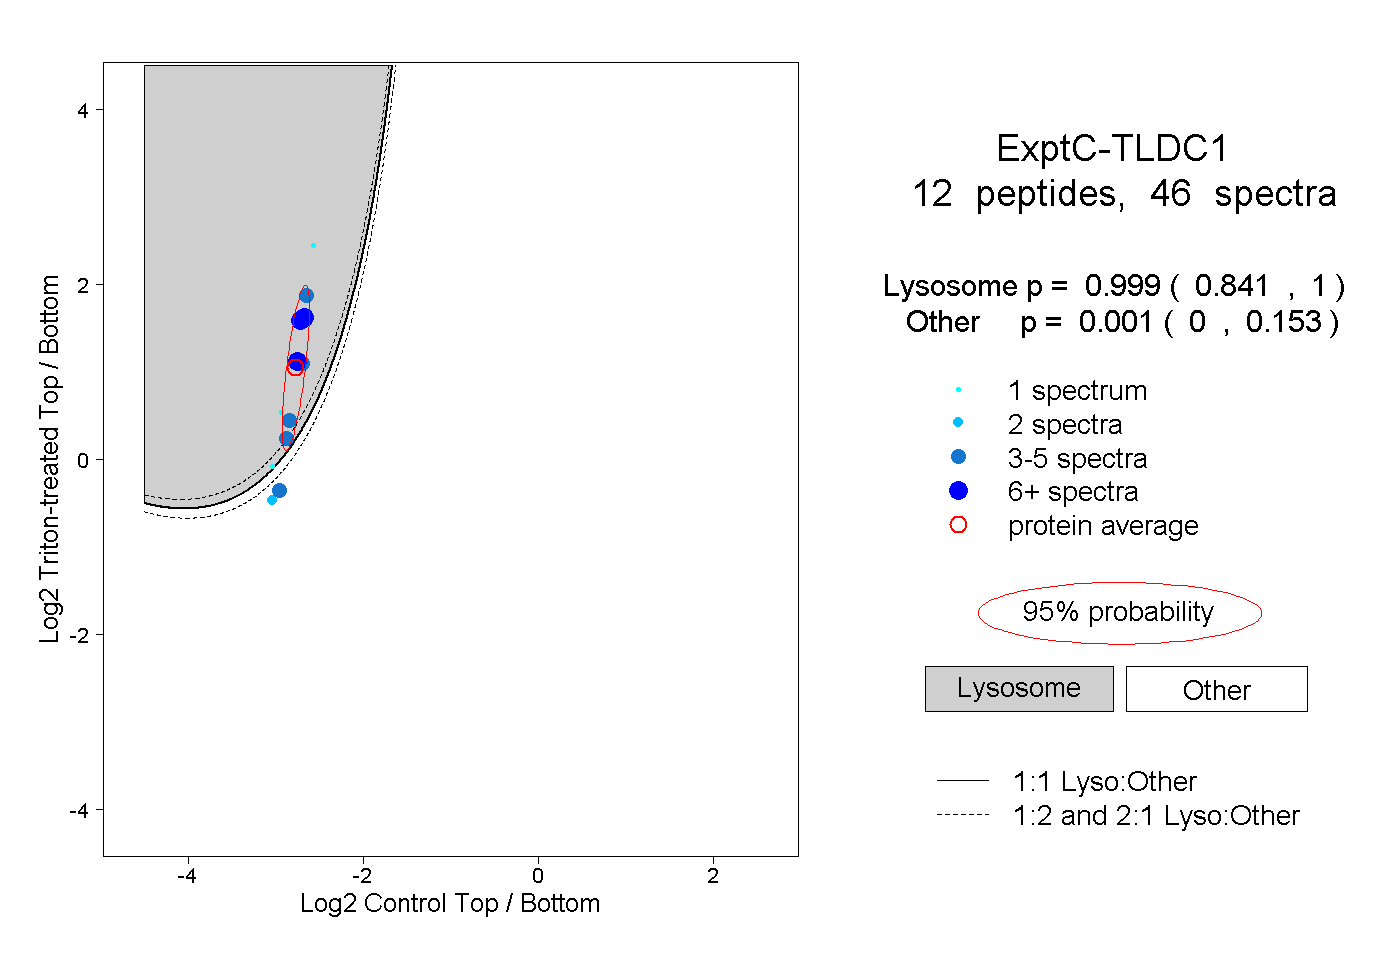 |
0.999 0.841 | 1.000 |
0.001 0.000 | 0.153 |