15
15peptides
spectra
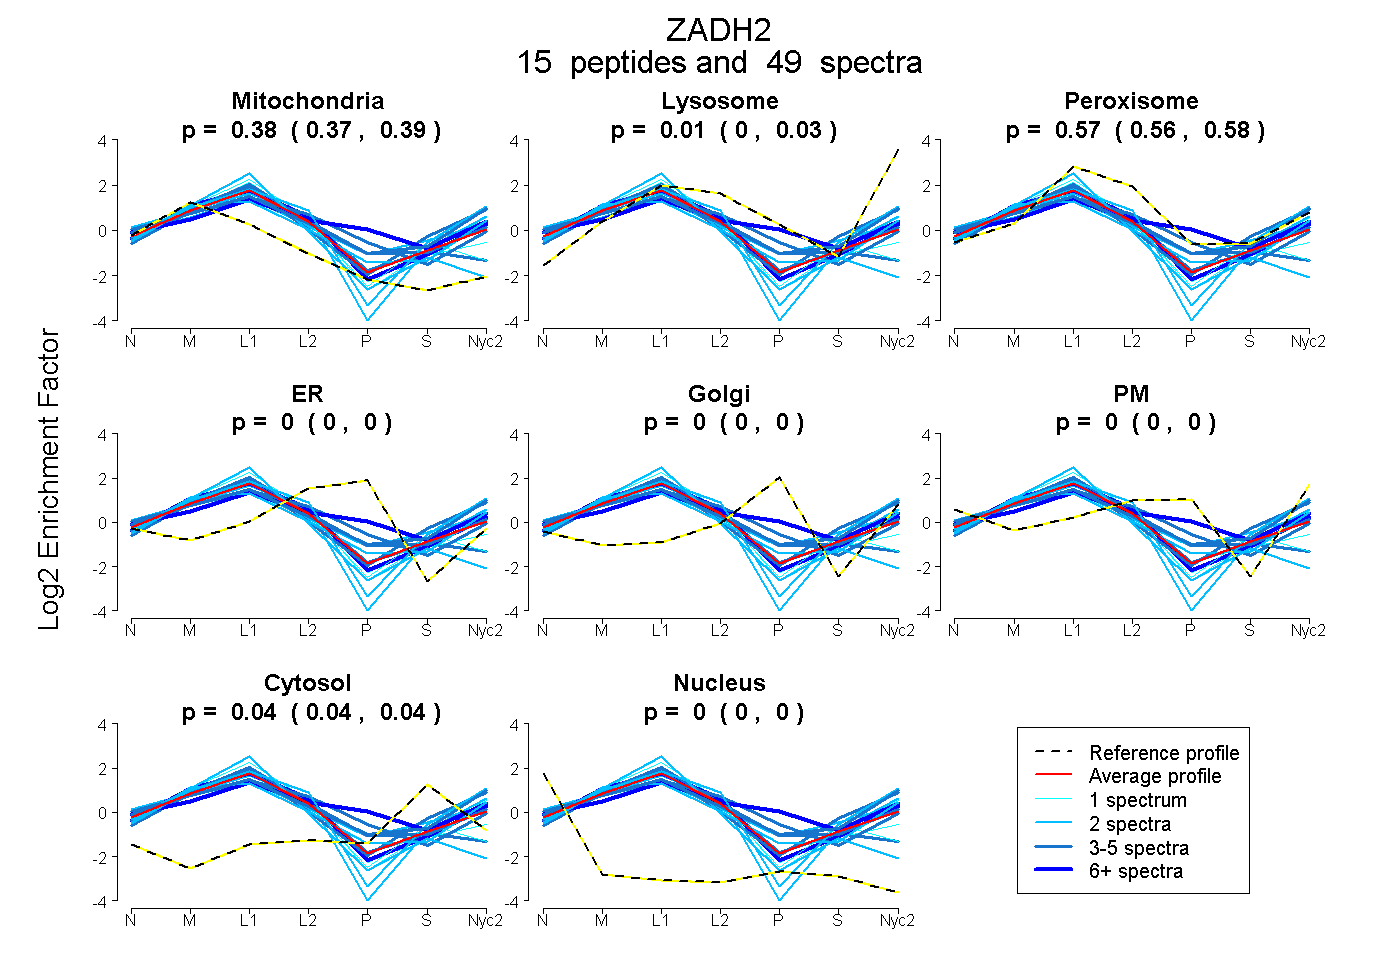
0.374 | 0.386
0.000 | 0.026
0.555 | 0.579
0.000 | 0.000
0.000 | 0.000
0.000 | 0.000
0.035 | 0.043
0.000 | 0.000
9peptides
spectra
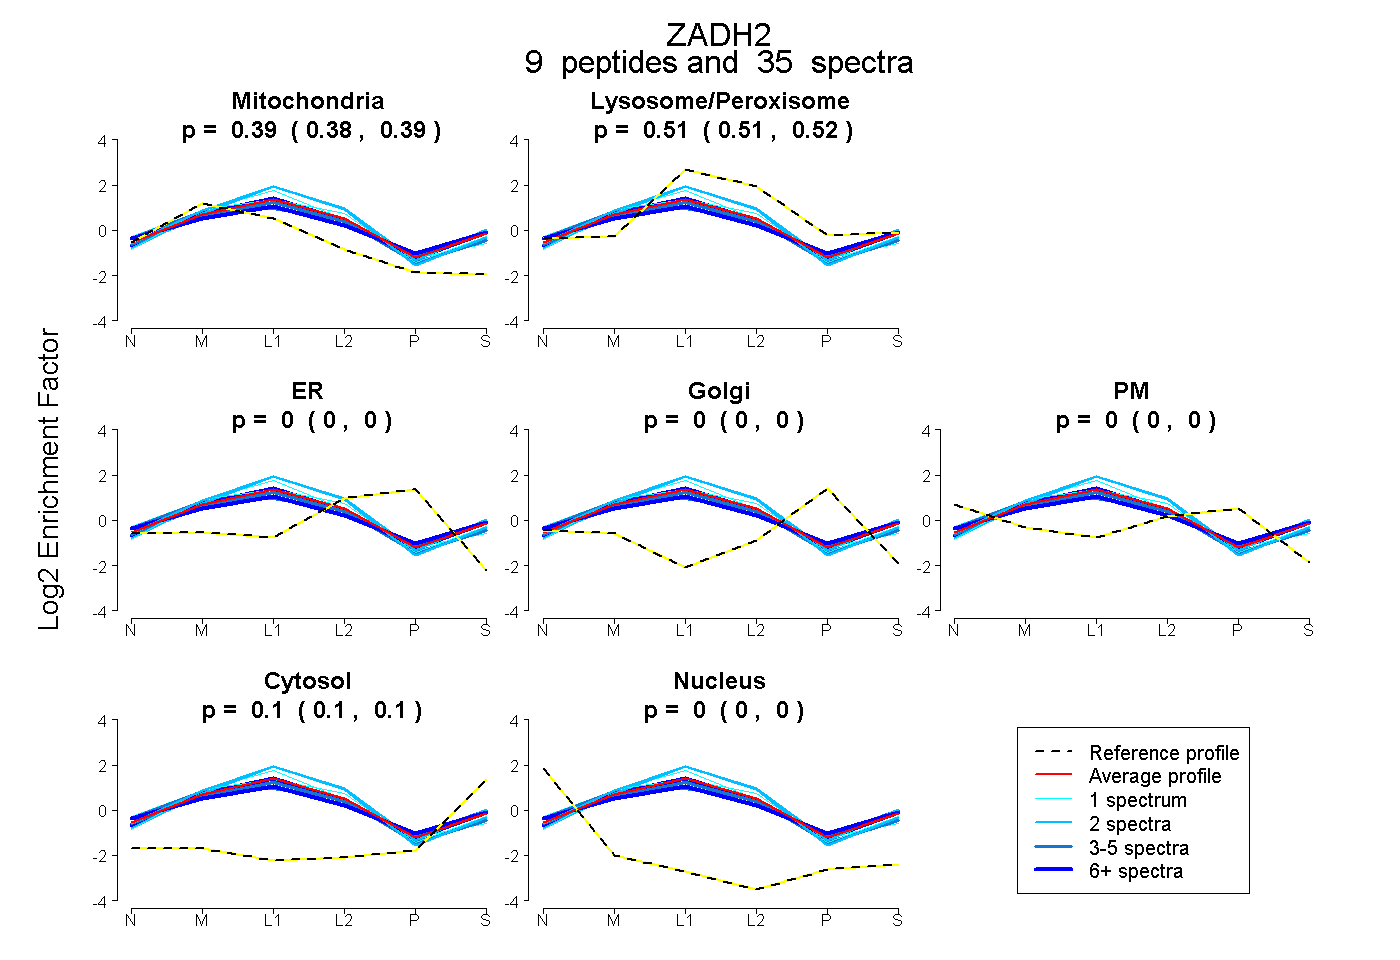
0.382 | 0.393
0.506 | 0.517
0.000 | 0.000
0.000 | 0.000
0.000 | 0.000
0.095 | 0.104
0.000 | 0.000