 15
15peptides
spectra
0.374 | 0.386
0.000 | 0.026
0.555 | 0.579
0.000 | 0.000
0.000 | 0.000
0.000 | 0.000
0.035 | 0.043
0.000 | 0.000
| Plot | Mito | Lyso | Perox | ER | Golgi | PM | Cytosol | Nucleus | |||||
| Expt A |
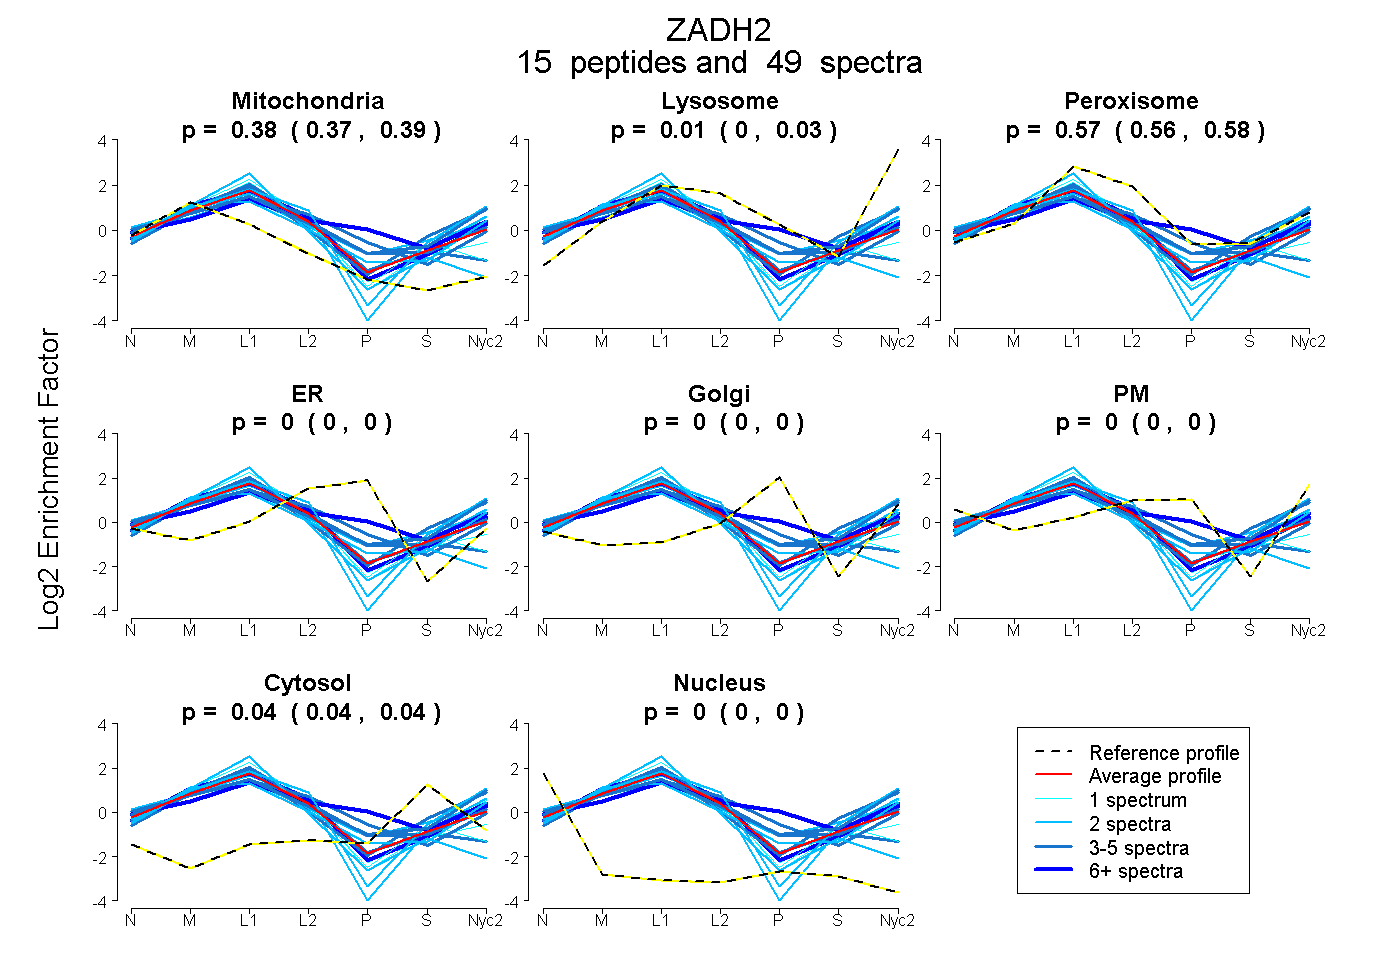
15 peptides |
49 spectra |
|
0.380 0.374 | 0.386 |
0.011 0.000 | 0.026 |
0.570 0.555 | 0.579 |
0.000 0.000 | 0.000 |
0.000 0.000 | 0.000 |
0.000 0.000 | 0.000 |
0.039 0.035 | 0.043 |
0.000 0.000 | 0.000 |
| 3 spectra, YQAAMEHLLQLYTR | 0.287 | 0.289 | 0.336 | 0.000 | 0.000 | 0.004 | 0.079 | 0.005 | ||
| 3 spectra, HFLDFQGSAIPR | 0.331 | 0.000 | 0.454 | 0.000 | 0.000 | 0.214 | 0.000 | 0.000 | ||
| 4 spectra, CHVVGTCSSDEK | 0.510 | 0.000 | 0.484 | 0.000 | 0.000 | 0.000 | 0.006 | 0.000 | ||
| 1 spectrum, AGALPAK | 0.360 | 0.043 | 0.596 | 0.000 | 0.000 | 0.000 | 0.000 | 0.000 | ||
| 2 spectra, TEPVETVLK | 0.313 | 0.109 | 0.546 | 0.000 | 0.000 | 0.000 | 0.031 | 0.000 | ||
| 9 spectra, SVGCDRPINYR | 0.156 | 0.000 | 0.532 | 0.000 | 0.196 | 0.065 | 0.051 | 0.000 | ||
| 1 spectrum, GDLVCEVDLGHLAPEGR | 0.490 | 0.000 | 0.474 | 0.000 | 0.000 | 0.000 | 0.036 | 0.000 | ||
| 5 spectra, GFFLNHYFDK | 0.271 | 0.183 | 0.437 | 0.000 | 0.000 | 0.000 | 0.110 | 0.000 | ||
| 2 spectra, VLVTAAAGGTGQFAVQLSK | 0.495 | 0.304 | 0.185 | 0.000 | 0.000 | 0.000 | 0.016 | 0.000 | ||
| 2 spectra, ELGELSEGK | 0.274 | 0.089 | 0.486 | 0.000 | 0.000 | 0.002 | 0.149 | 0.000 | ||
| 1 spectrum, DCPVPLPGDGDLLVR | 0.467 | 0.000 | 0.533 | 0.000 | 0.000 | 0.000 | 0.000 | 0.000 | ||
| 5 spectra, LSPNFHEAVTLR | 0.353 | 0.084 | 0.560 | 0.000 | 0.000 | 0.000 | 0.004 | 0.000 | ||
| 2 spectra, LVVELPHPVSSK | 0.644 | 0.000 | 0.356 | 0.000 | 0.000 | 0.000 | 0.000 | 0.000 | ||
| 2 spectra, FIGLESIFQAVDYMYSGK | 0.434 | 0.000 | 0.539 | 0.000 | 0.000 | 0.000 | 0.027 | 0.000 | ||
| 7 spectra, FVGINASDINYSAGR | 0.411 | 0.066 | 0.523 | 0.000 | 0.000 | 0.000 | 0.000 | 0.000 |
| Plot | Mito | Lyso or Perox | ER | Golgi | PM | Cytosol | Nucleus | ||||||
| Expt B |
9 peptides |
35 spectra |
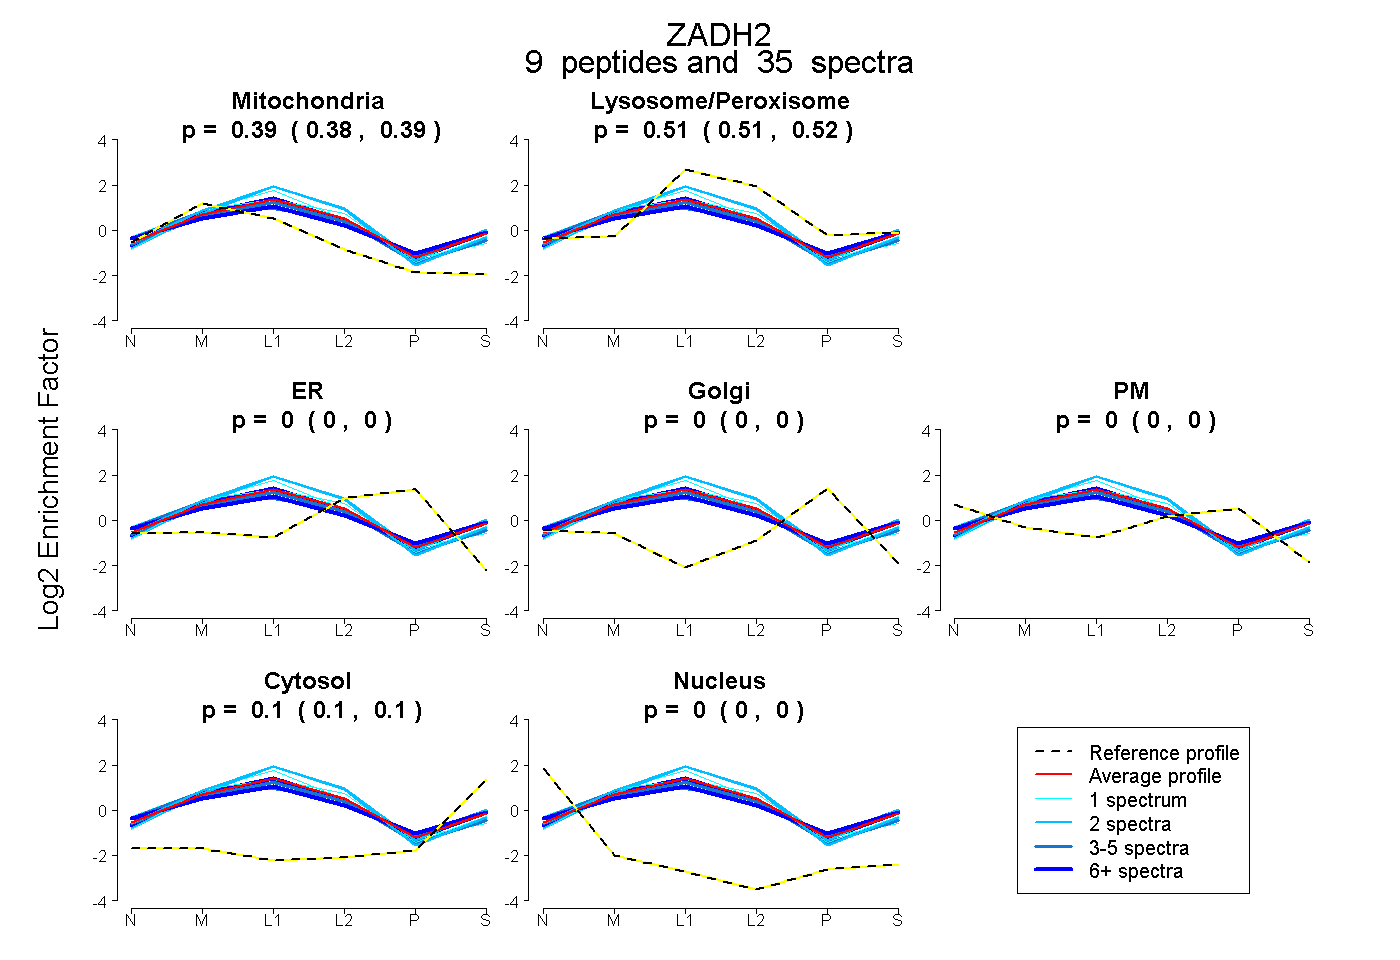 |
0.388 0.382 | 0.393 |
0.512 0.506 | 0.517 |
0.000 0.000 | 0.000 |
0.000 0.000 | 0.000 |
0.000 0.000 | 0.000 |
0.100 0.095 | 0.104 |
0.000 0.000 | 0.000 |
|||
| Plot | Lyso | Other | |||||||||||
| Expt C |
12 peptides |
237 spectra |
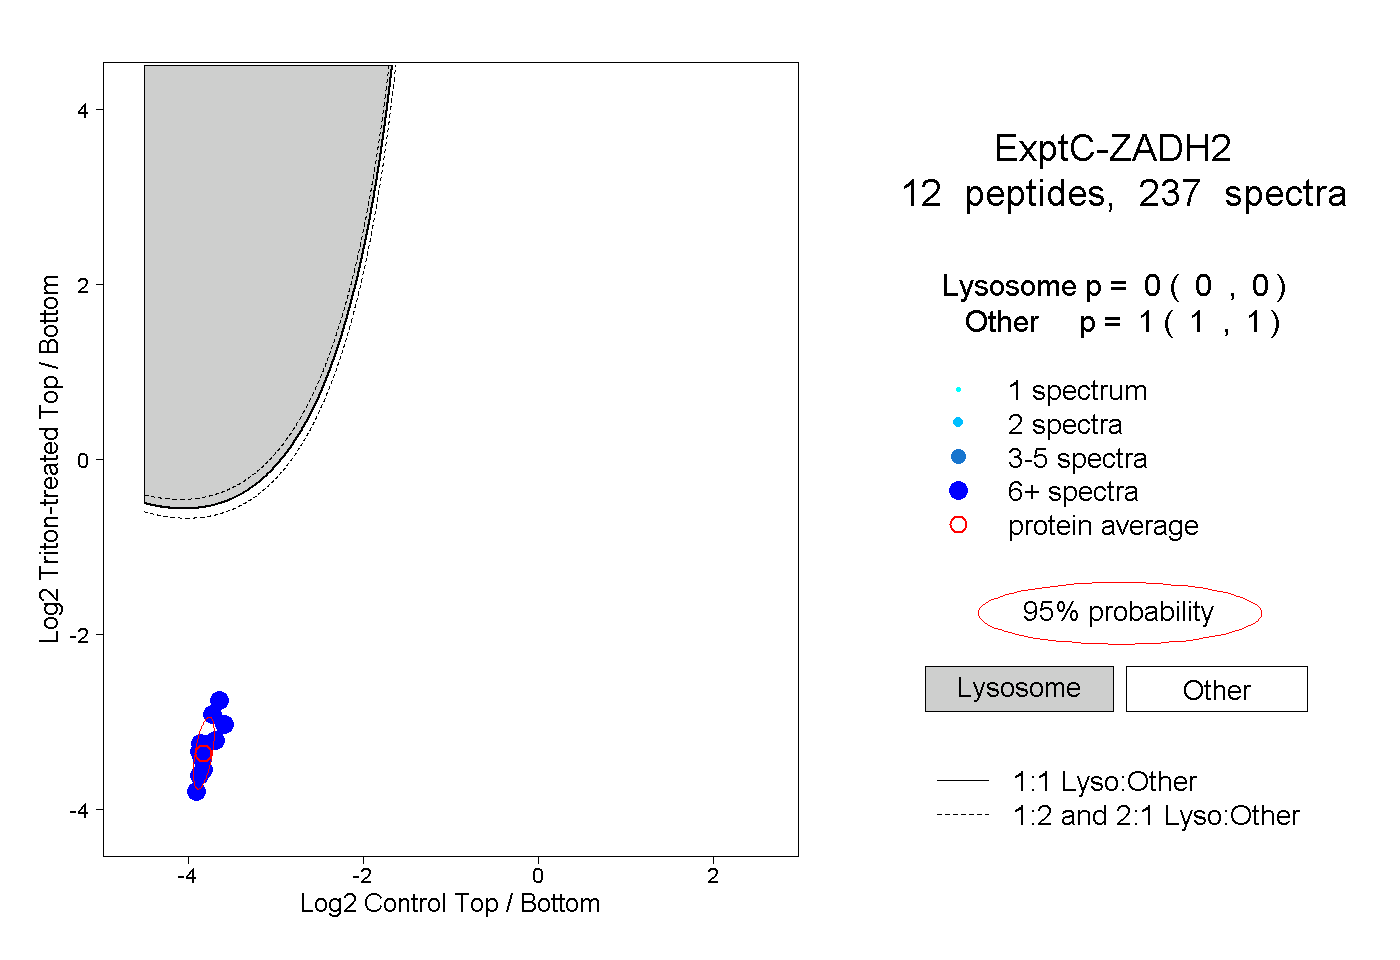 |
0.000 0.000 | 0.000 |
1.000 1.000 | 1.000 |
||||||||
| Plot | Lyso | Other | |||||||||||
| Expt D |
6 peptides |
20 spectra |
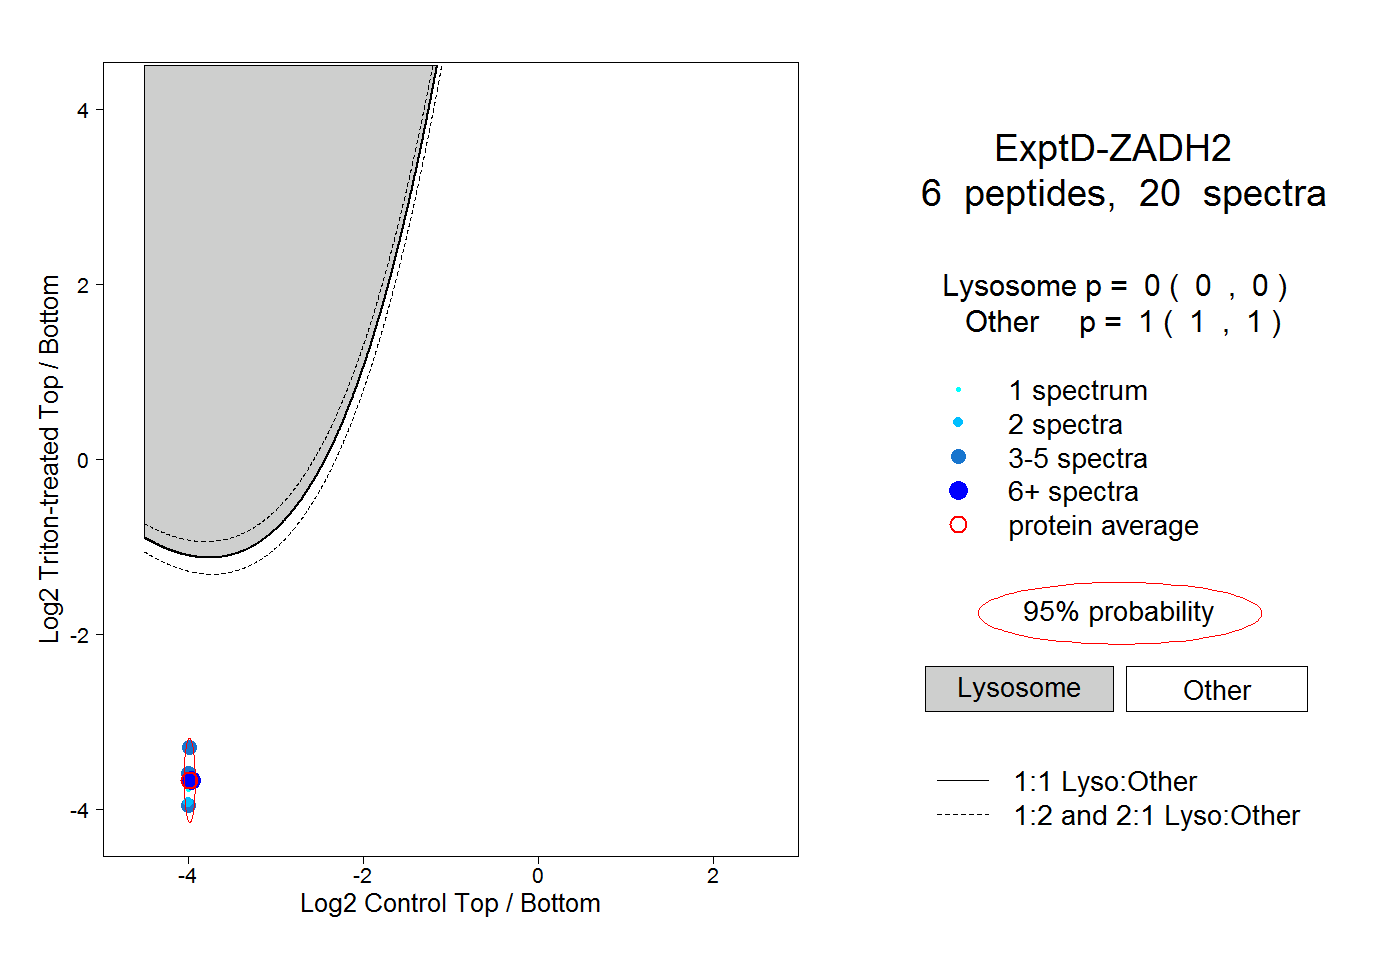 |
0.000 0.000 | 0.000 |
1.000 1.000 | 1.000 |