 18
18peptides
spectra
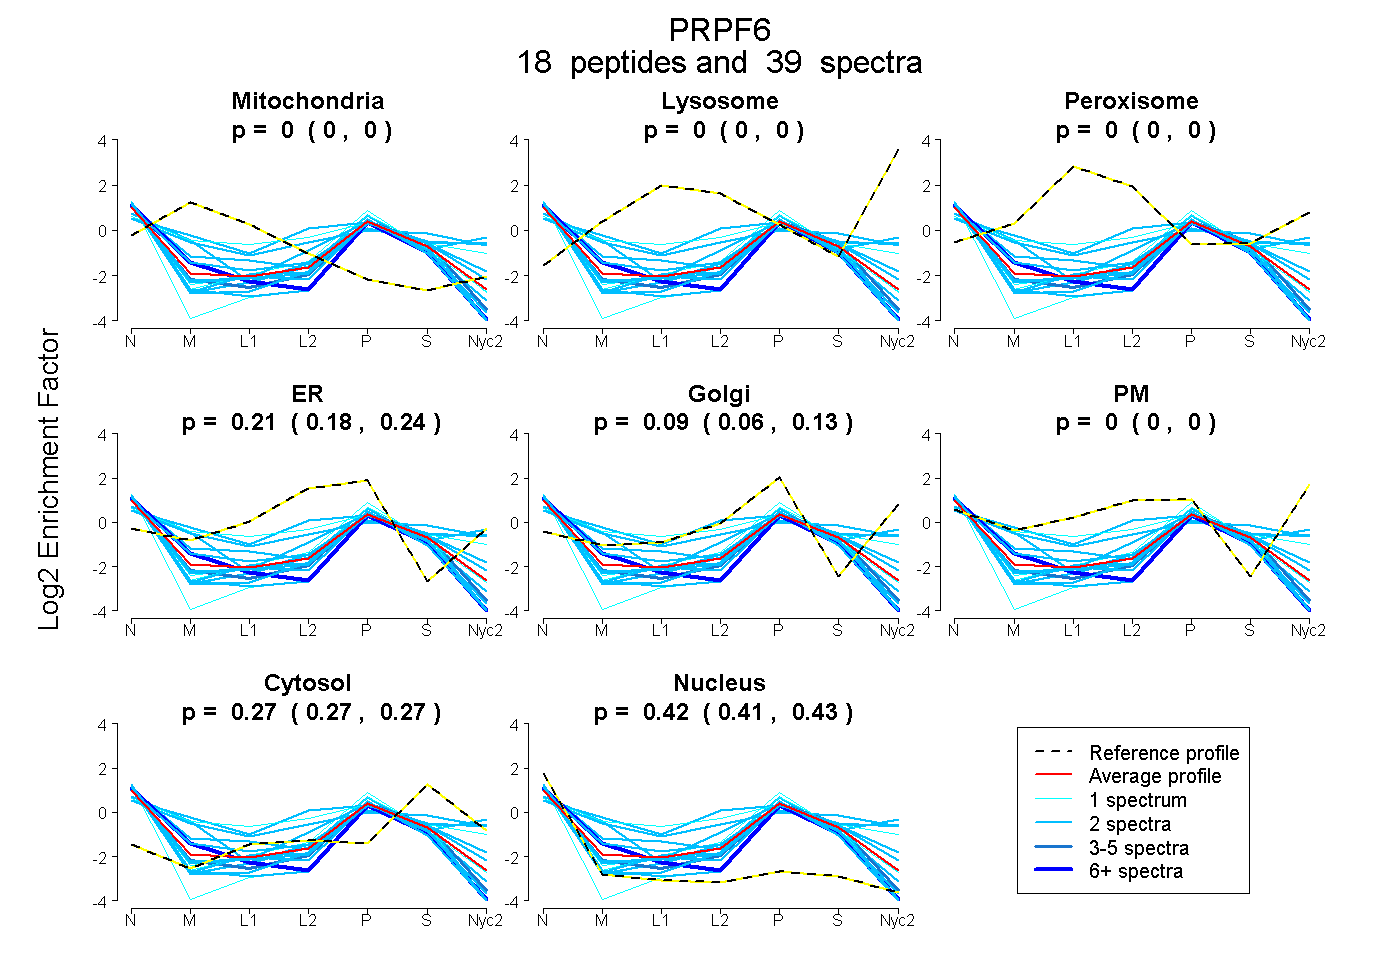
0.000 | 0.000
0.000 | 0.000
0.000 | 0.000
0.179 | 0.240
0.056 | 0.126
0.000 | 0.000
0.266 | 0.274
0.414 | 0.430
| Plot | Mito | Lyso | Perox | ER | Golgi | PM | Cytosol | Nucleus | |||||
| Expt A |
18 peptides |
39 spectra |
|
0.000 0.000 | 0.000 |
0.000 0.000 | 0.000 |
0.000 0.000 | 0.000 |
0.212 0.179 | 0.240 |
0.094 0.056 | 0.126 |
0.000 0.000 | 0.000 |
0.270 0.266 | 0.274 |
0.423 0.414 | 0.430 |
| 2 spectra, SDIGPAR | 0.000 | 0.000 | 0.000 | 0.000 | 0.368 | 0.000 | 0.342 | 0.291 | ||
| 1 spectrum, GQIEEQGELMER | 0.145 | 0.000 | 0.023 | 0.272 | 0.000 | 0.180 | 0.296 | 0.085 | ||
| 2 spectra, LETYENAR | 0.000 | 0.000 | 0.000 | 0.256 | 0.000 | 0.000 | 0.160 | 0.584 | ||
| 2 spectra, LFWSER | 0.000 | 0.000 | 0.000 | 0.139 | 0.248 | 0.000 | 0.284 | 0.329 | ||
| 2 spectra, ETNPHHPPAWIASAR | 0.131 | 0.000 | 0.000 | 0.216 | 0.000 | 0.298 | 0.308 | 0.047 | ||
| 1 spectrum, AEVLWLMGAK | 0.000 | 0.000 | 0.000 | 0.201 | 0.100 | 0.000 | 0.276 | 0.423 | ||
| 2 spectra, AVAHCPK | 0.153 | 0.000 | 0.000 | 0.201 | 0.000 | 0.000 | 0.224 | 0.421 | ||
| 2 spectra, AAELETDIR | 0.000 | 0.000 | 0.000 | 0.258 | 0.020 | 0.000 | 0.226 | 0.495 | ||
| 1 spectrum, AAVELEEPEDAR | 0.000 | 0.000 | 0.000 | 0.000 | 0.050 | 0.000 | 0.290 | 0.660 | ||
| 2 spectra, NPGLWLESVR | 0.000 | 0.000 | 0.000 | 0.229 | 0.000 | 0.000 | 0.211 | 0.560 | ||
| 2 spectra, LESENNEYER | 0.000 | 0.000 | 0.000 | 0.192 | 0.000 | 0.000 | 0.225 | 0.582 | ||
| 2 spectra, ESLEALLQR | 0.000 | 0.000 | 0.000 | 0.043 | 0.101 | 0.000 | 0.200 | 0.656 | ||
| 1 spectrum, AVVAQAVR | 0.000 | 0.000 | 0.000 | 0.290 | 0.056 | 0.000 | 0.238 | 0.416 | ||
| 2 spectra, ALEHVPNSVR | 0.121 | 0.000 | 0.000 | 0.035 | 0.032 | 0.327 | 0.413 | 0.073 | ||
| 6 spectra, LEEVTGK | 0.000 | 0.000 | 0.000 | 0.211 | 0.004 | 0.000 | 0.177 | 0.607 | ||
| 5 spectra, AGSVATCQAVMR | 0.000 | 0.000 | 0.000 | 0.200 | 0.000 | 0.000 | 0.280 | 0.521 | ||
| 2 spectra, FELQHGTEEQQEEVR | 0.000 | 0.000 | 0.000 | 0.308 | 0.027 | 0.000 | 0.306 | 0.360 | ||
| 2 spectra, ANGVEINR | 0.000 | 0.000 | 0.000 | 0.000 | 0.286 | 0.223 | 0.251 | 0.240 |
| Plot | Mito | Lyso or Perox | ER | Golgi | PM | Cytosol | Nucleus | ||||||
| Expt B |
3 peptides |
4 spectra |
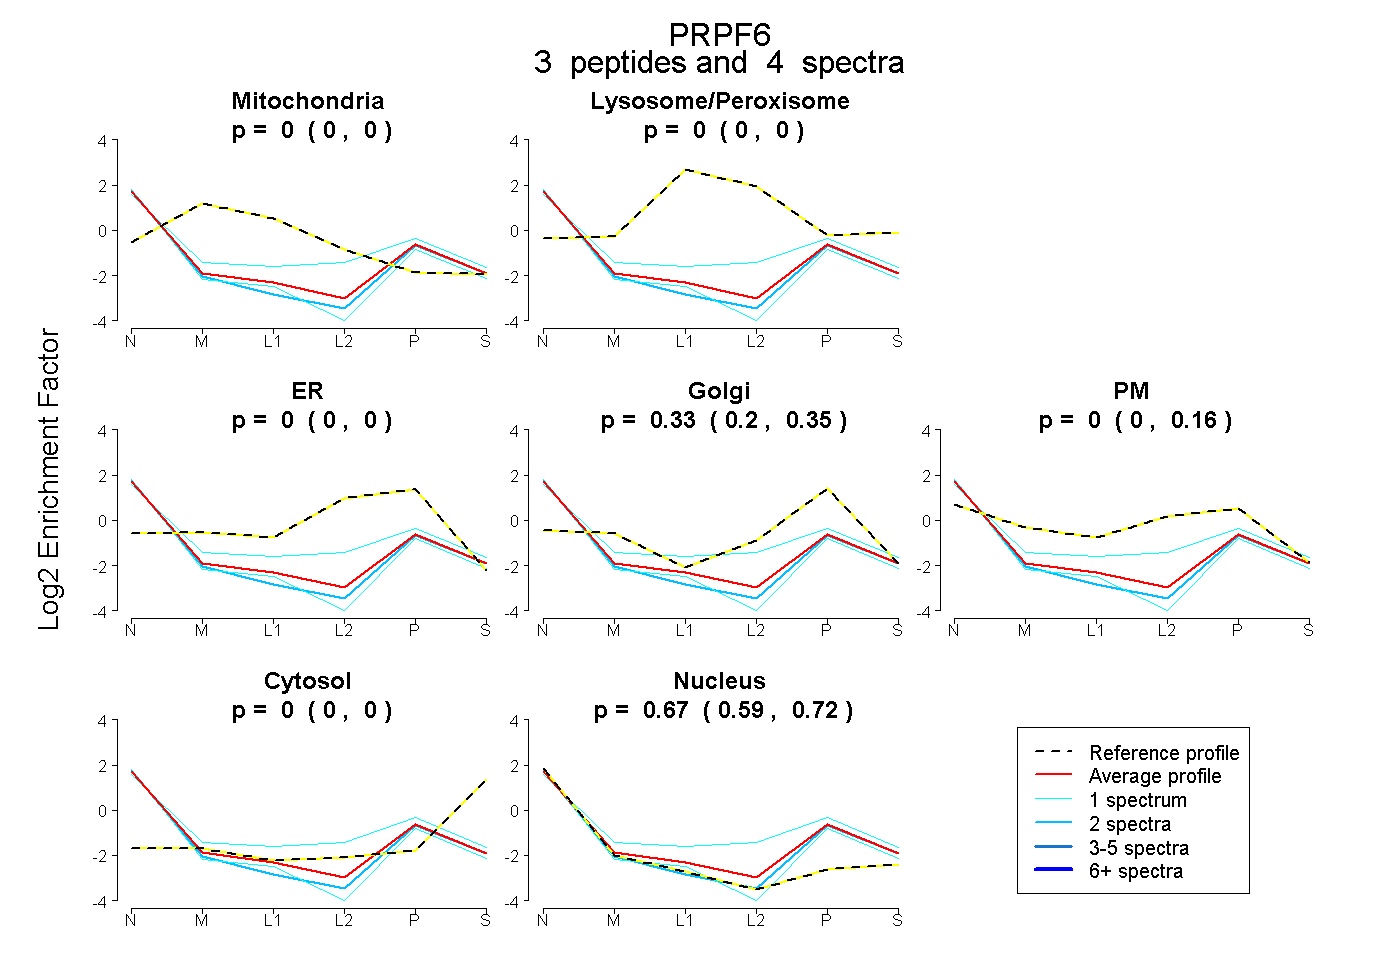 |
0.000 0.000 | 0.000 |
0.000 0.000 | 0.000 |
0.000 0.000 | 0.000 |
0.331 0.204 | 0.346 |
0.000 0.000 | 0.162 |
0.000 0.000 | 0.000 |
0.669 0.591 | 0.723 |
|||
| Plot | Lyso | Other | |||||||||||
| Expt C |
3 peptides |
5 spectra |
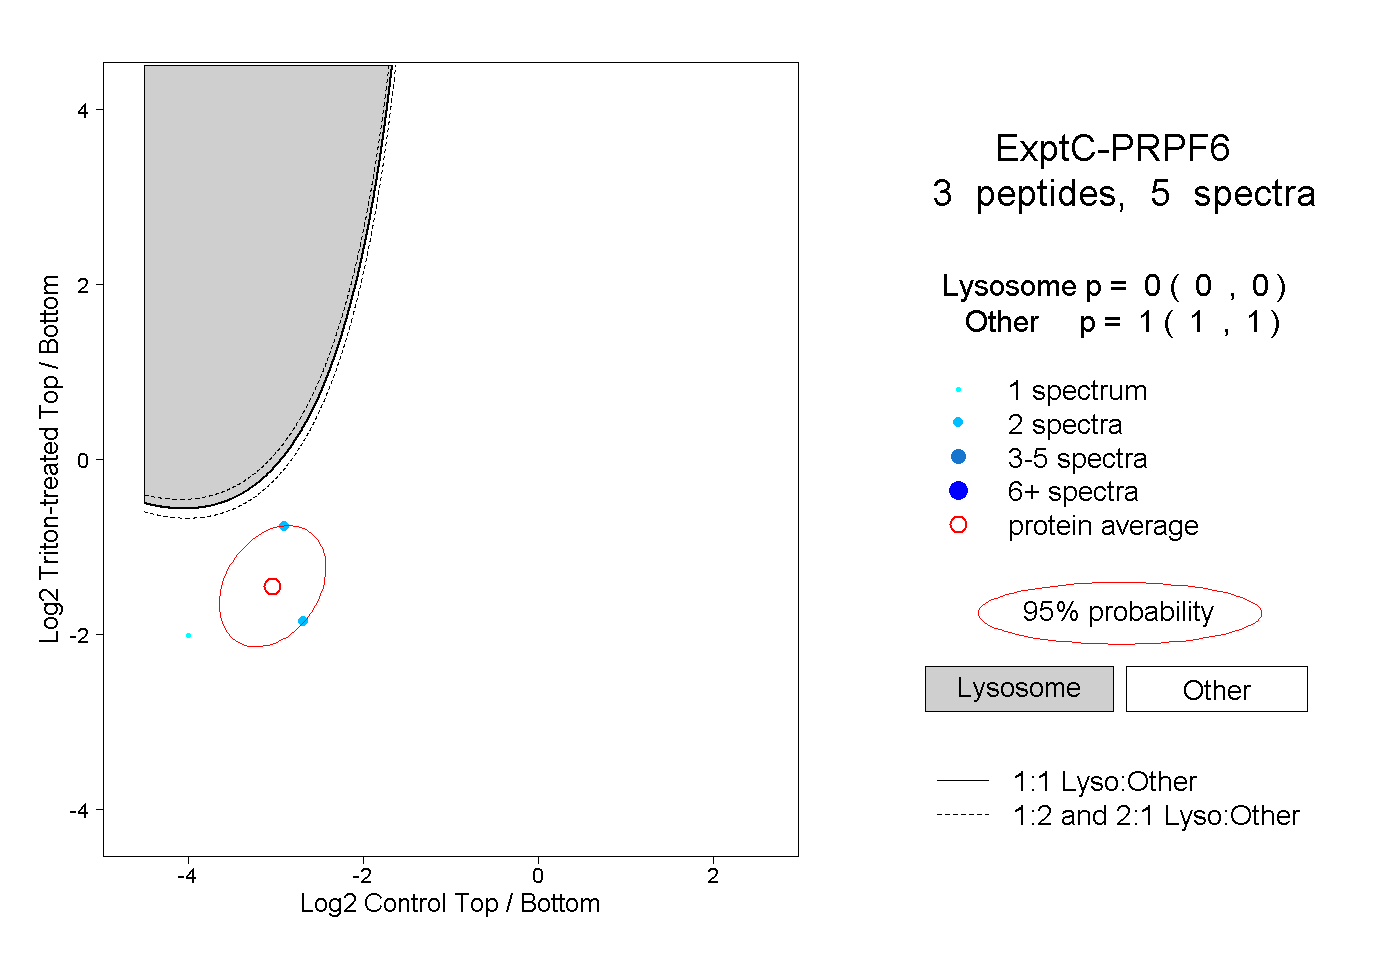 |
0.000 0.000 | 0.000 |
1.000 1.000 | 1.000 |