 6
6peptides
spectra
0.000 | 0.000
0.366 | 0.402
0.000 | 0.000
0.000 | 0.000
0.024 | 0.057
0.539 | 0.600
0.000 | 0.000
0.000 | 0.000
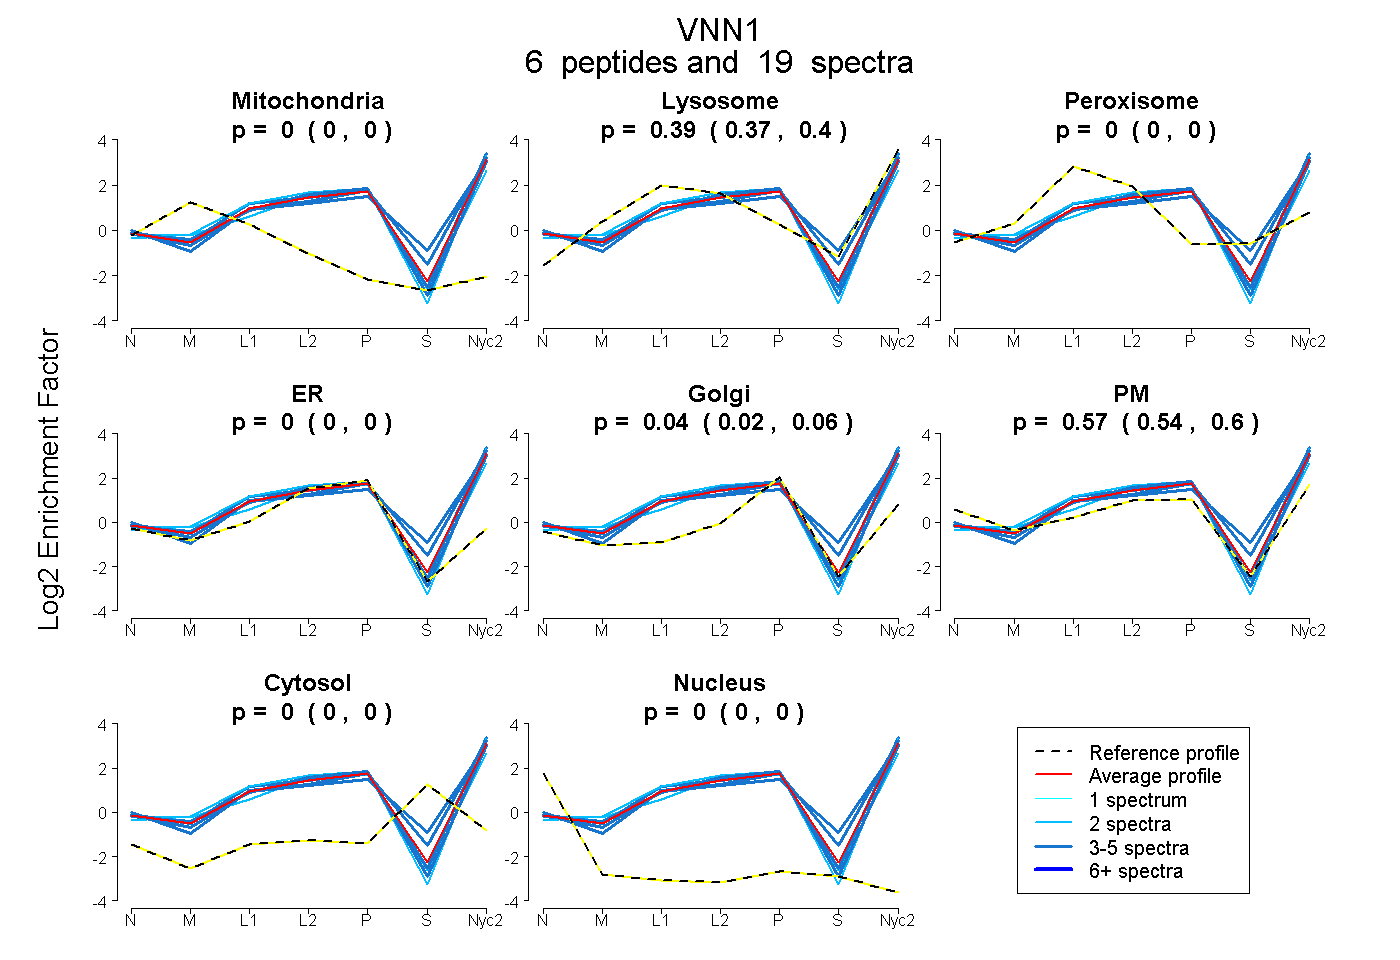
| Plot | Mito | Lyso | Perox | ER | Golgi | PM | Cytosol | Nucleus | |||||
| Expt A |
6 peptides |
19 spectra |
|
0.000 0.000 | 0.000 |
0.386 0.366 | 0.402 |
0.000 0.000 | 0.000 |
0.000 0.000 | 0.000 |
0.042 0.024 | 0.057 |
0.572 0.539 | 0.600 |
0.000 0.000 | 0.000 |
0.000 0.000 | 0.000 |
| 2 spectra, MTGSGIYAPDSPR | 0.000 | 0.391 | 0.000 | 0.000 | 0.000 | 0.609 | 0.000 | 0.000 | ||
| 4 spectra, FQYNTDVVFDSR | 0.000 | 0.401 | 0.000 | 0.000 | 0.000 | 0.599 | 0.000 | 0.000 | ||
| 3 spectra, YVFPEVLLSEVK | 0.000 | 0.434 | 0.000 | 0.000 | 0.116 | 0.450 | 0.000 | 0.000 | ||
| 4 spectra, TCGSSVDTASTR | 0.000 | 0.313 | 0.000 | 0.000 | 0.014 | 0.673 | 0.000 | 0.000 | ||
| 4 spectra, LAPGEFQVLSDGR | 0.000 | 0.523 | 0.000 | 0.000 | 0.157 | 0.312 | 0.007 | 0.000 | ||
| 2 spectra, FGSTPVQER | 0.000 | 0.282 | 0.000 | 0.045 | 0.038 | 0.635 | 0.000 | 0.000 |
| Plot | Mito | Lyso or Perox | ER | Golgi | PM | Cytosol | Nucleus | ||||||
| Expt B |
1 peptide |
2 spectra |
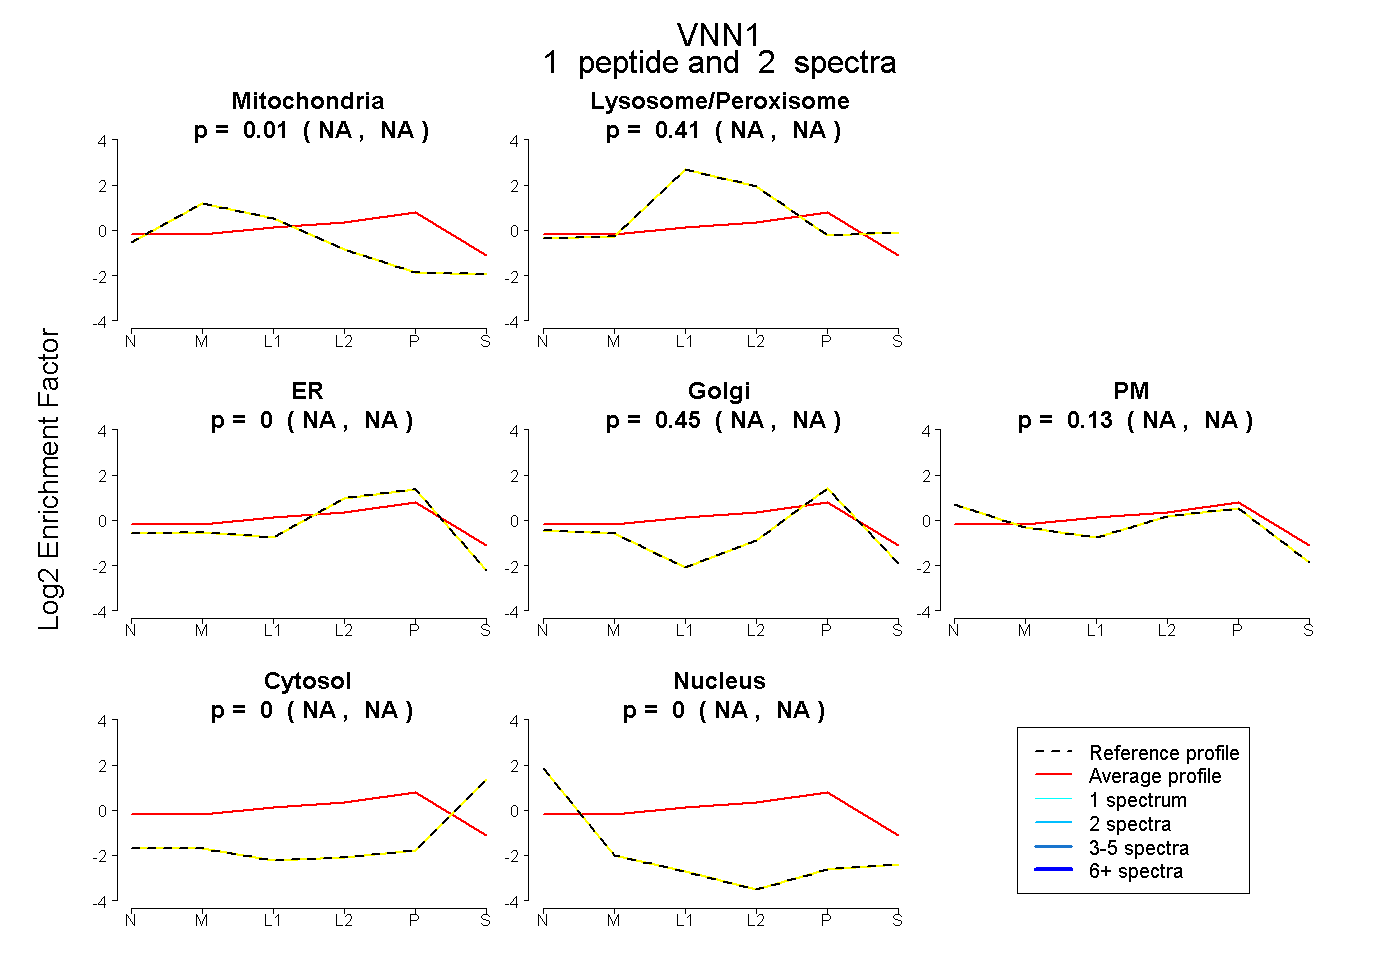 |
0.007 NA | NA |
0.408 NA | NA |
0.000 NA | NA |
0.451 NA | NA |
0.134 NA | NA |
0.000 NA | NA |
0.000 NA | NA |
|||
| Plot | Lyso | Other | |||||||||||
| Expt C |
8 peptides |
38 spectra |
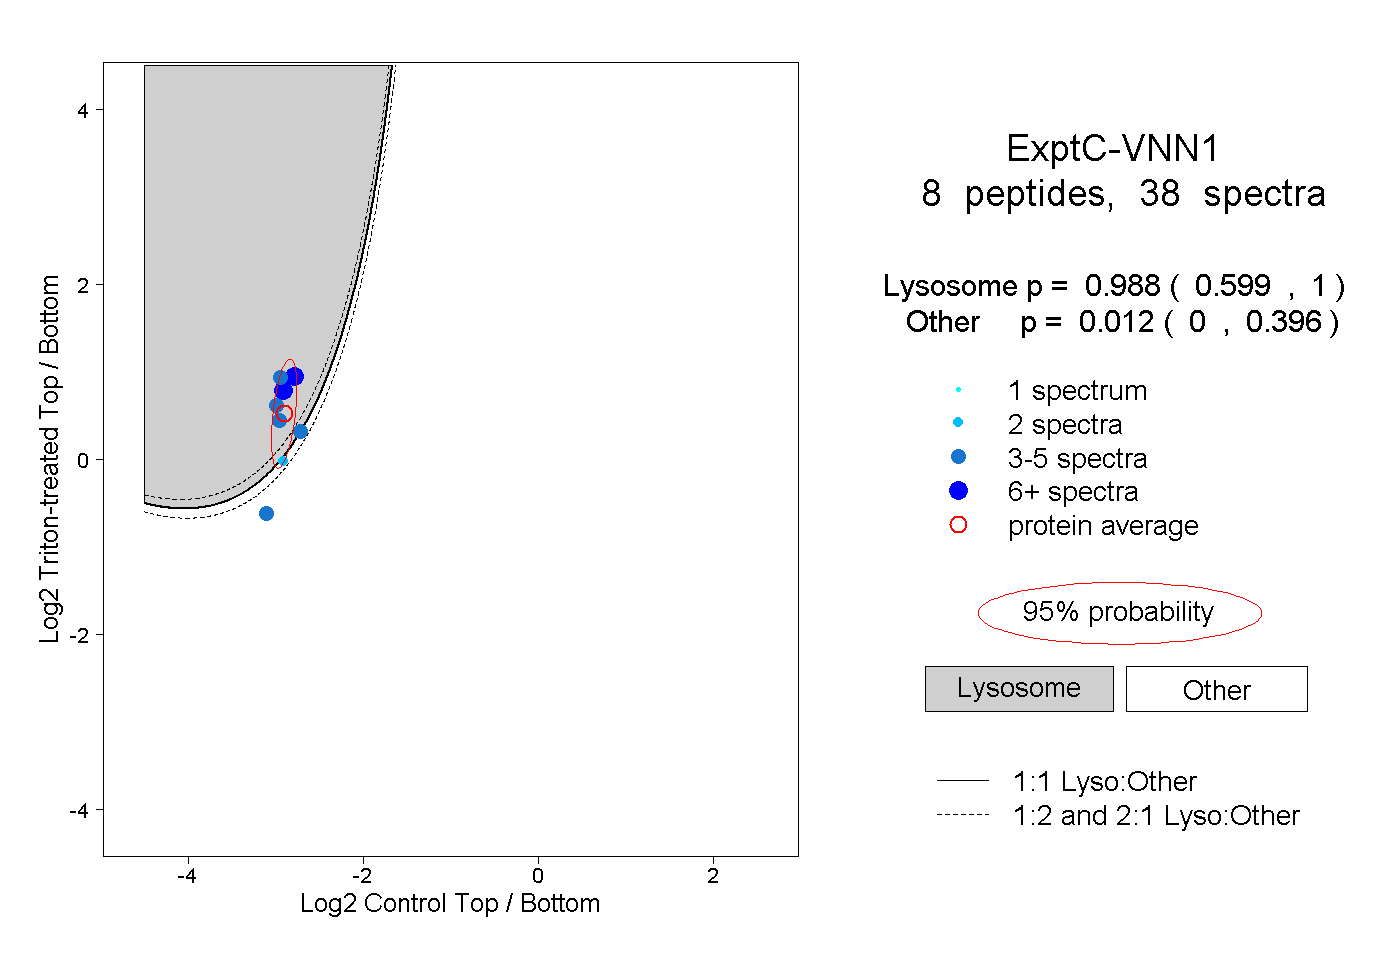 |
0.988 0.599 | 1.000 |
0.012 0.000 | 0.396 |
||||||||
| Plot | Lyso | Other | |||||||||||
| Expt D |
2 peptides |
4 spectra |
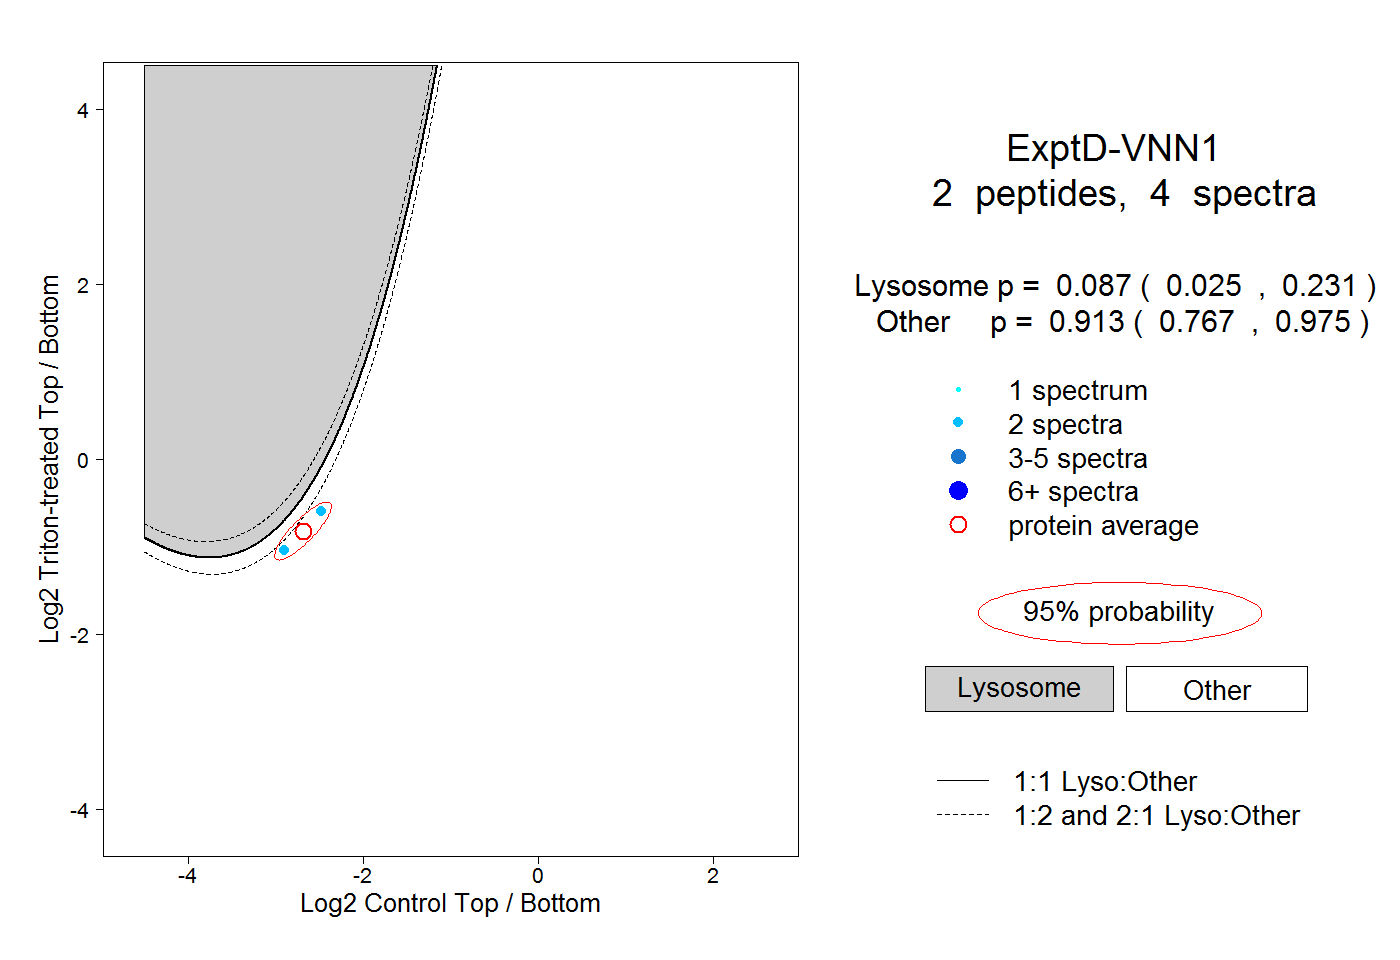 |
0.087 0.025 | 0.231 |
0.913 0.767 | 0.975 |