 3
3peptides
spectra
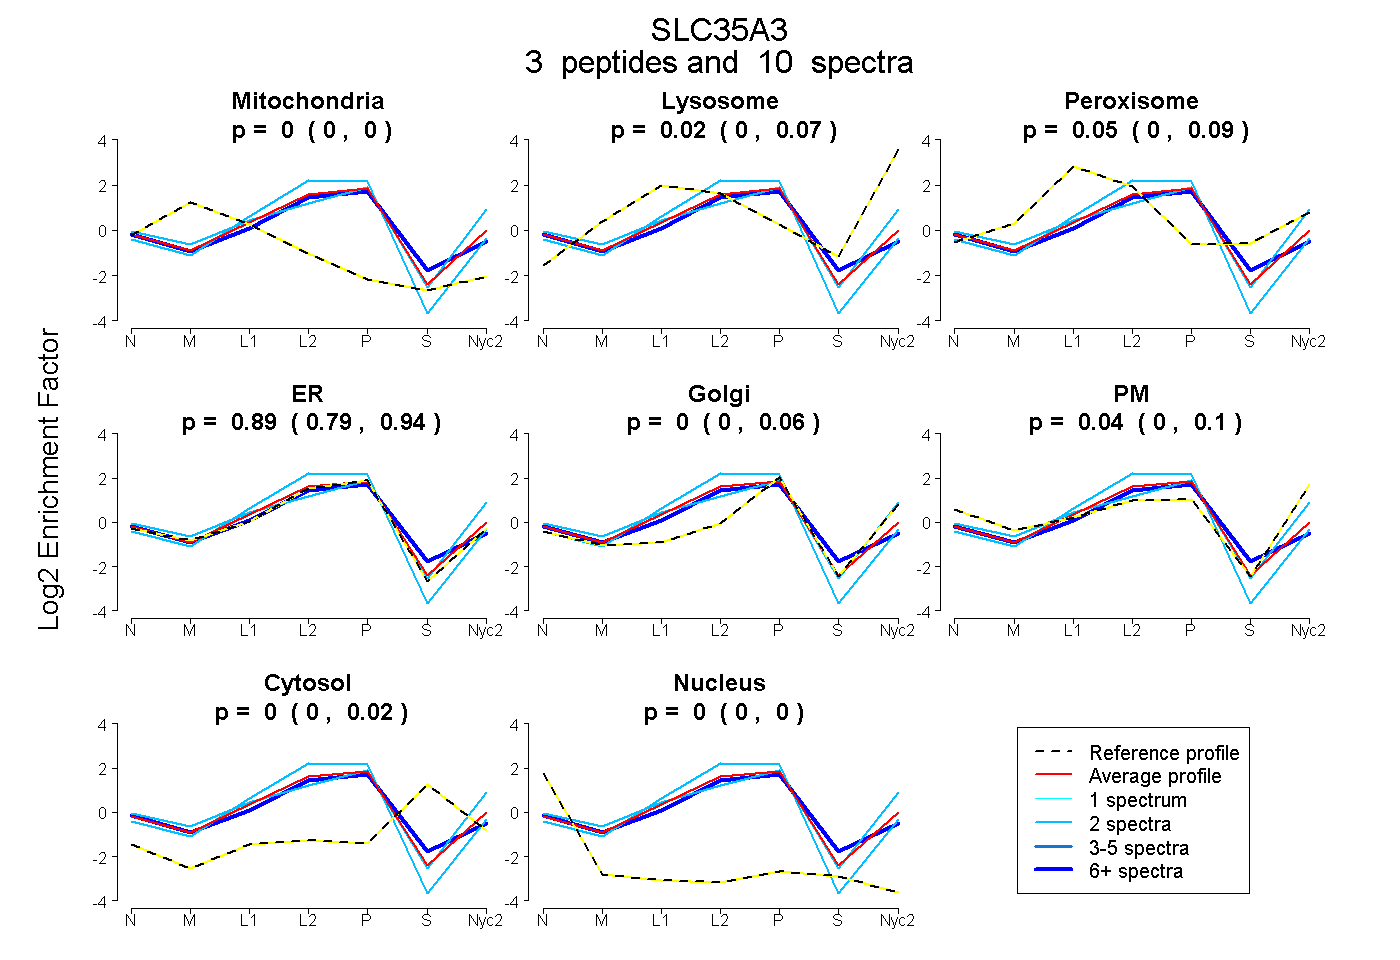
0.000 | 0.000
0.000 | 0.071
0.000 | 0.092
0.787 | 0.938
0.000 | 0.062
0.000 | 0.099
0.000 | 0.017
0.000 | 0.000
2peptides
spectra
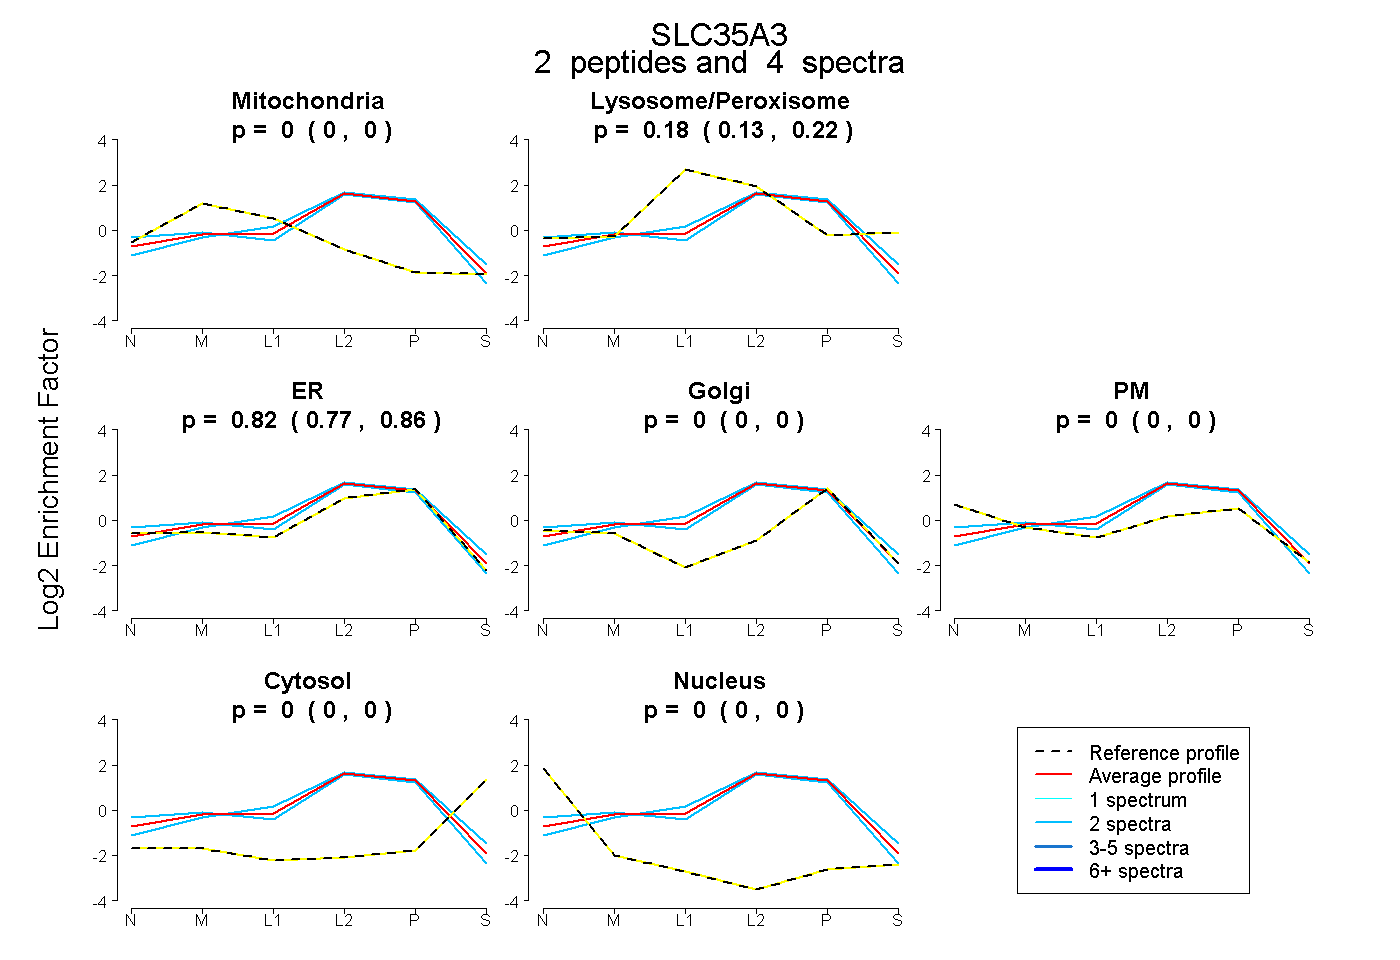
0.000 | 0.000
0.130 | 0.217
0.774 | 0.861
0.000 | 0.000
0.000 | 0.000
0.000 | 0.000
0.000 | 0.000
2peptides
spectra
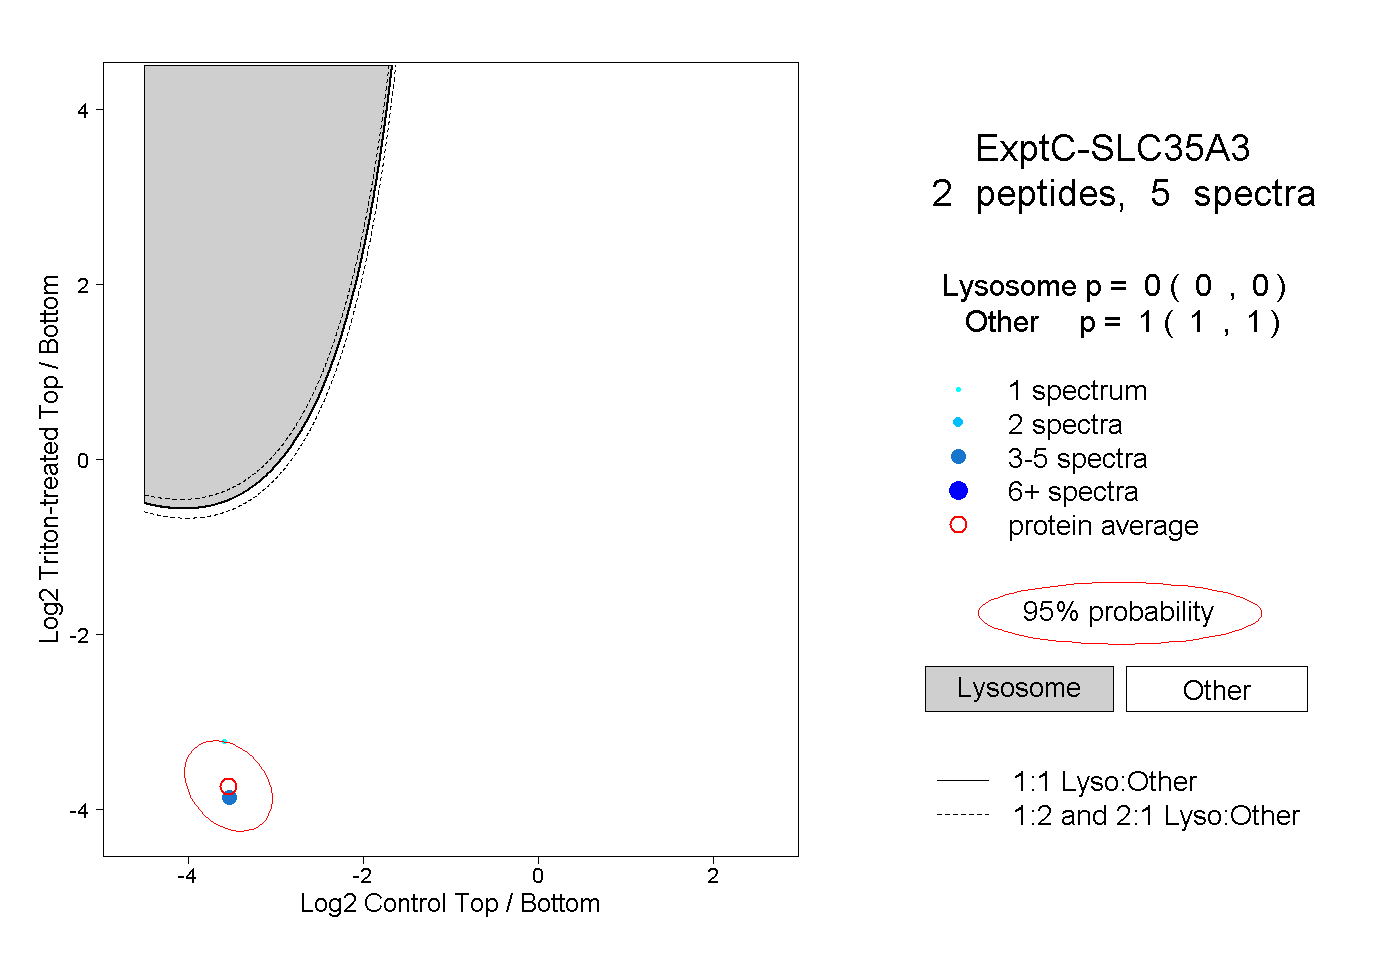
0.000 | 0.000
1.000 | 1.000
1peptide
spectra
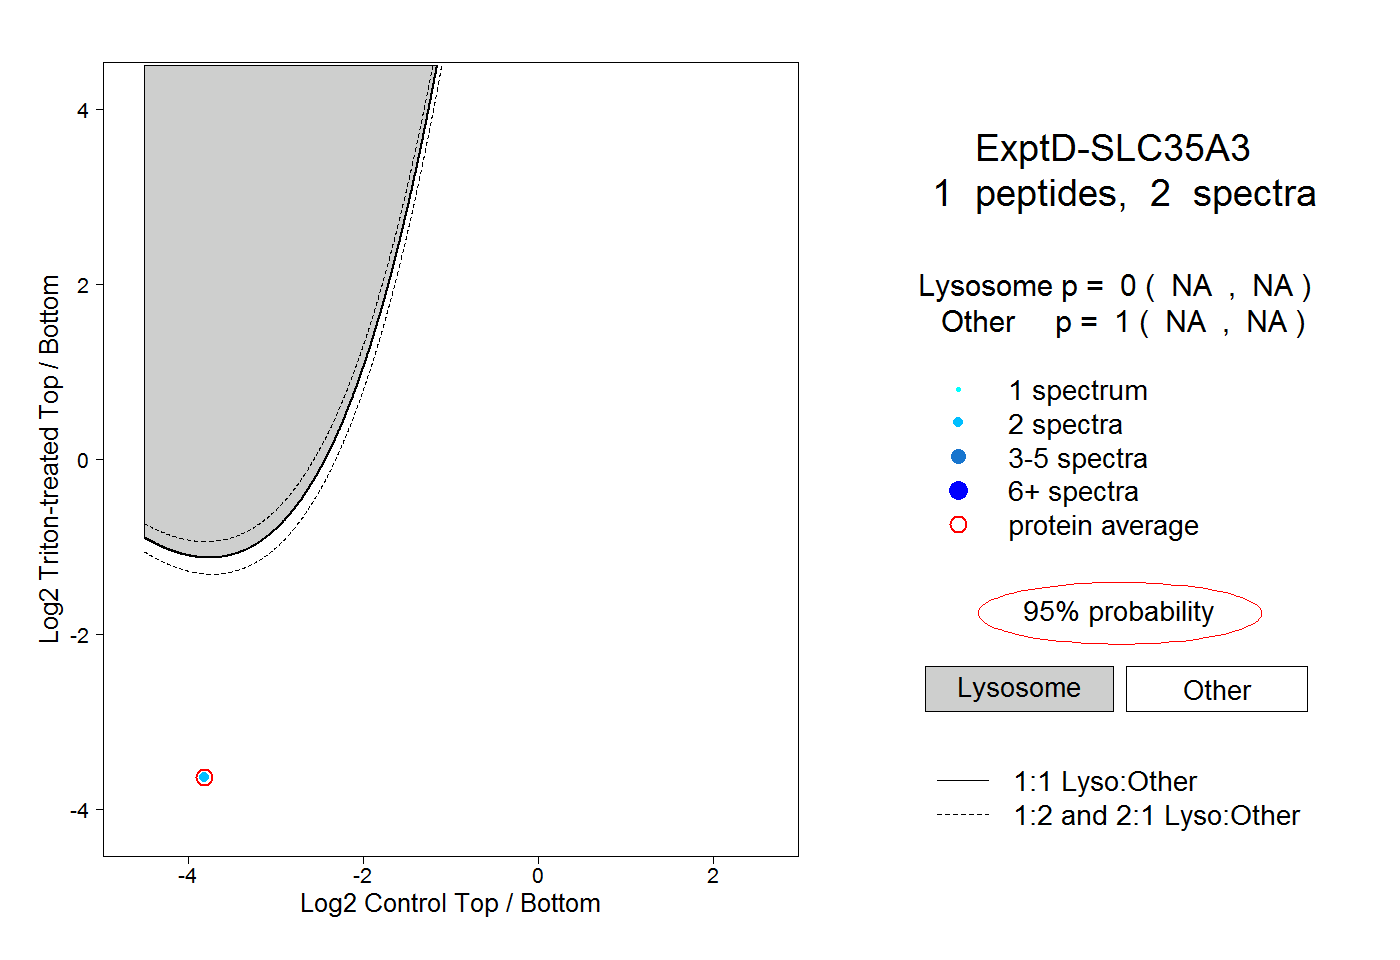
NA | NA
NA | NA