10
10peptides
spectra
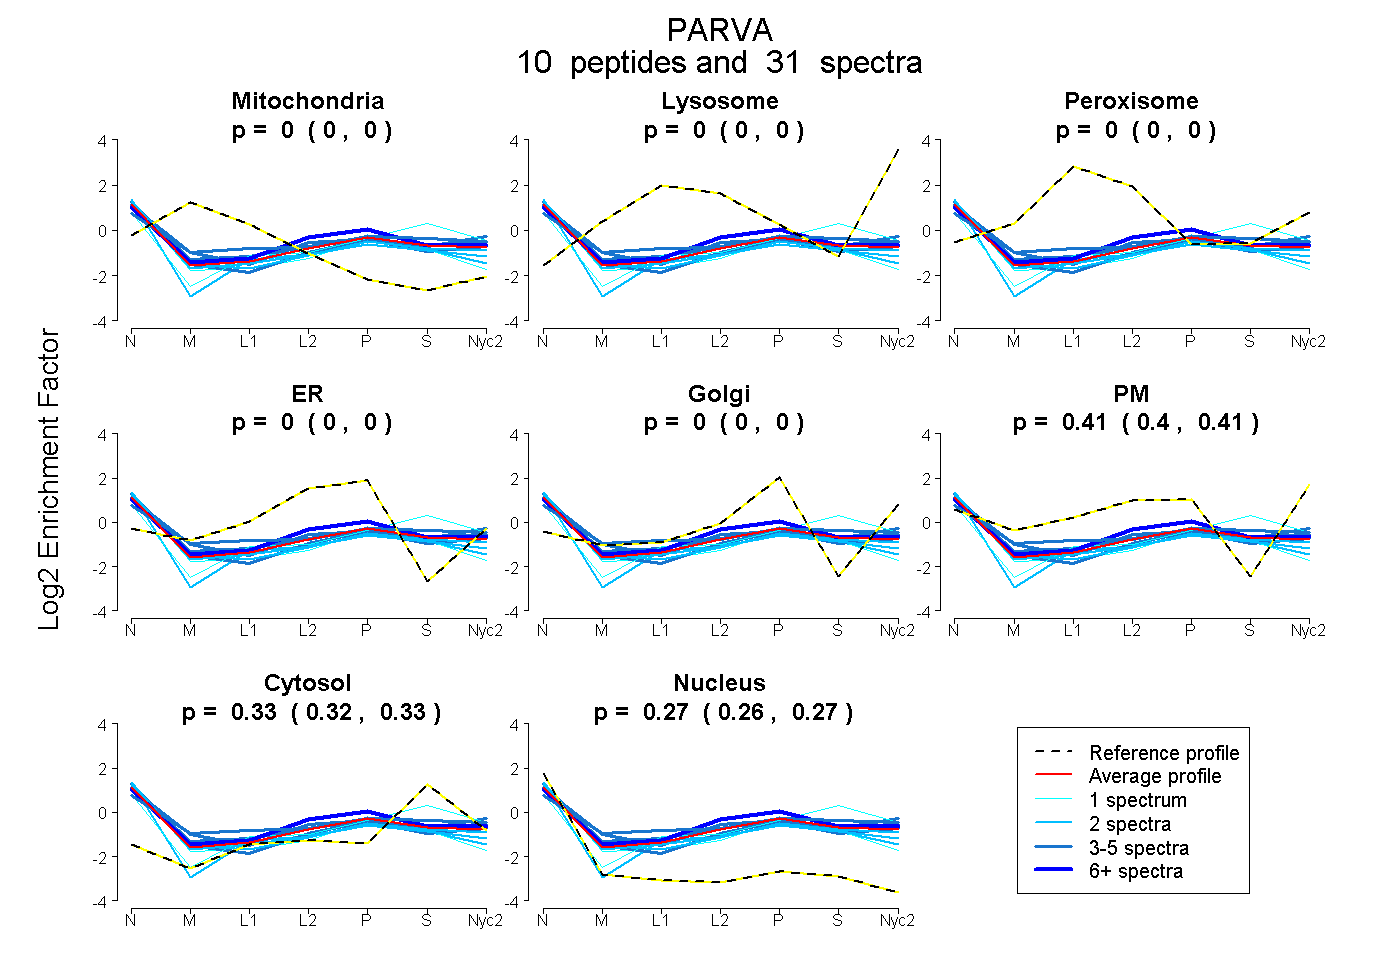
0.000 | 0.000
0.000 | 0.000
0.000 | 0.000
0.000 | 0.000
0.000 | 0.000
0.400 | 0.411
0.319 | 0.331
0.263 | 0.273
3peptides
spectra
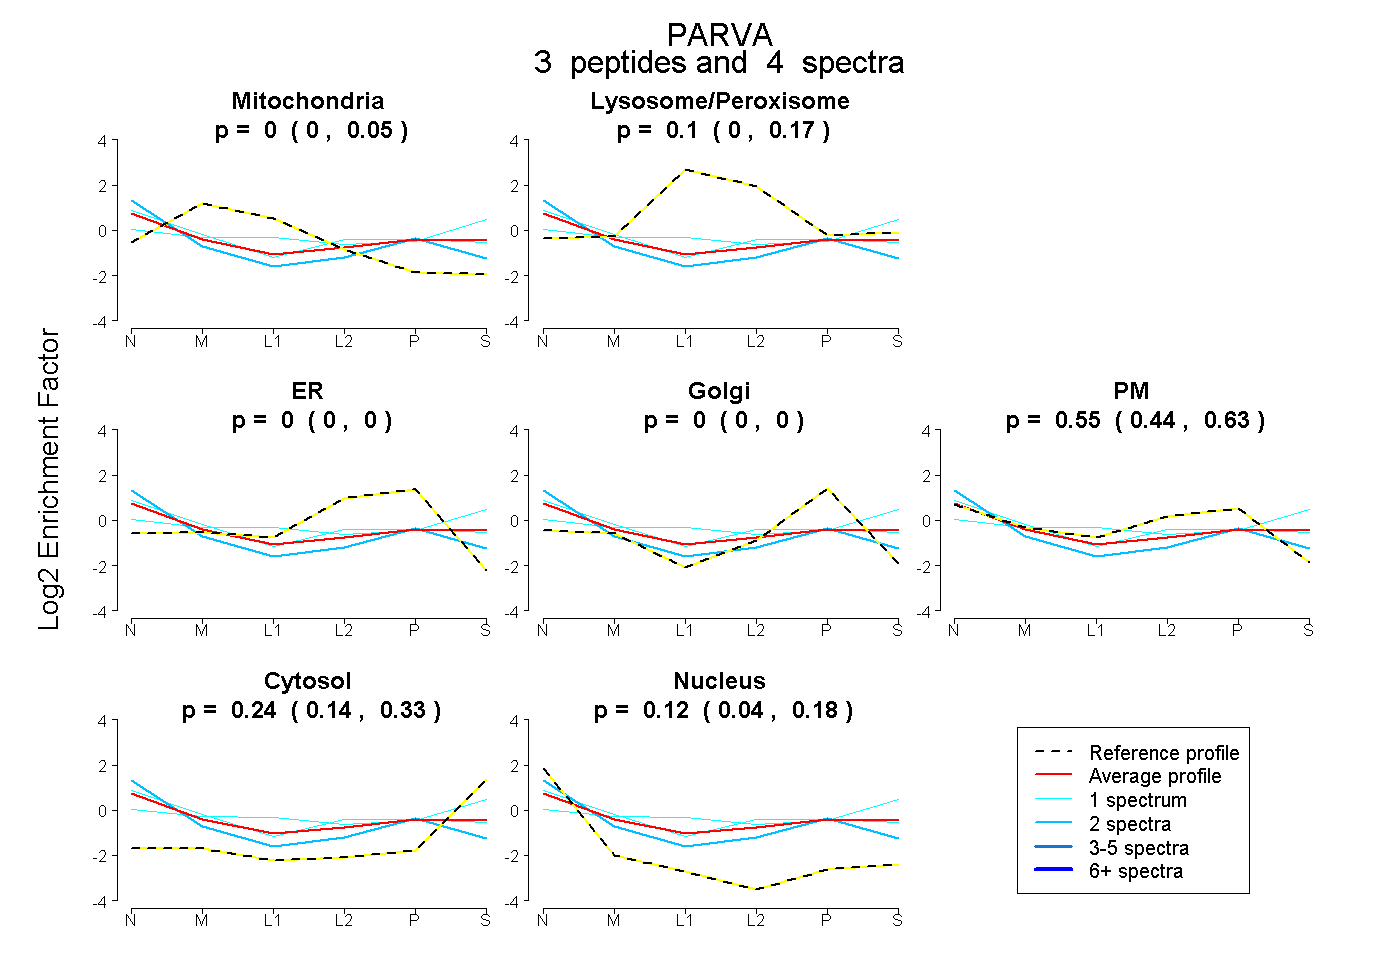
0.000 | 0.052
0.000 | 0.171
0.000 | 0.000
0.000 | 0.000
0.443 | 0.630
0.142 | 0.325
0.040 | 0.177