 10
10peptides
spectra
0.000 | 0.000
0.000 | 0.000
0.000 | 0.000
0.000 | 0.000
0.000 | 0.000
0.400 | 0.411
0.319 | 0.331
0.263 | 0.273
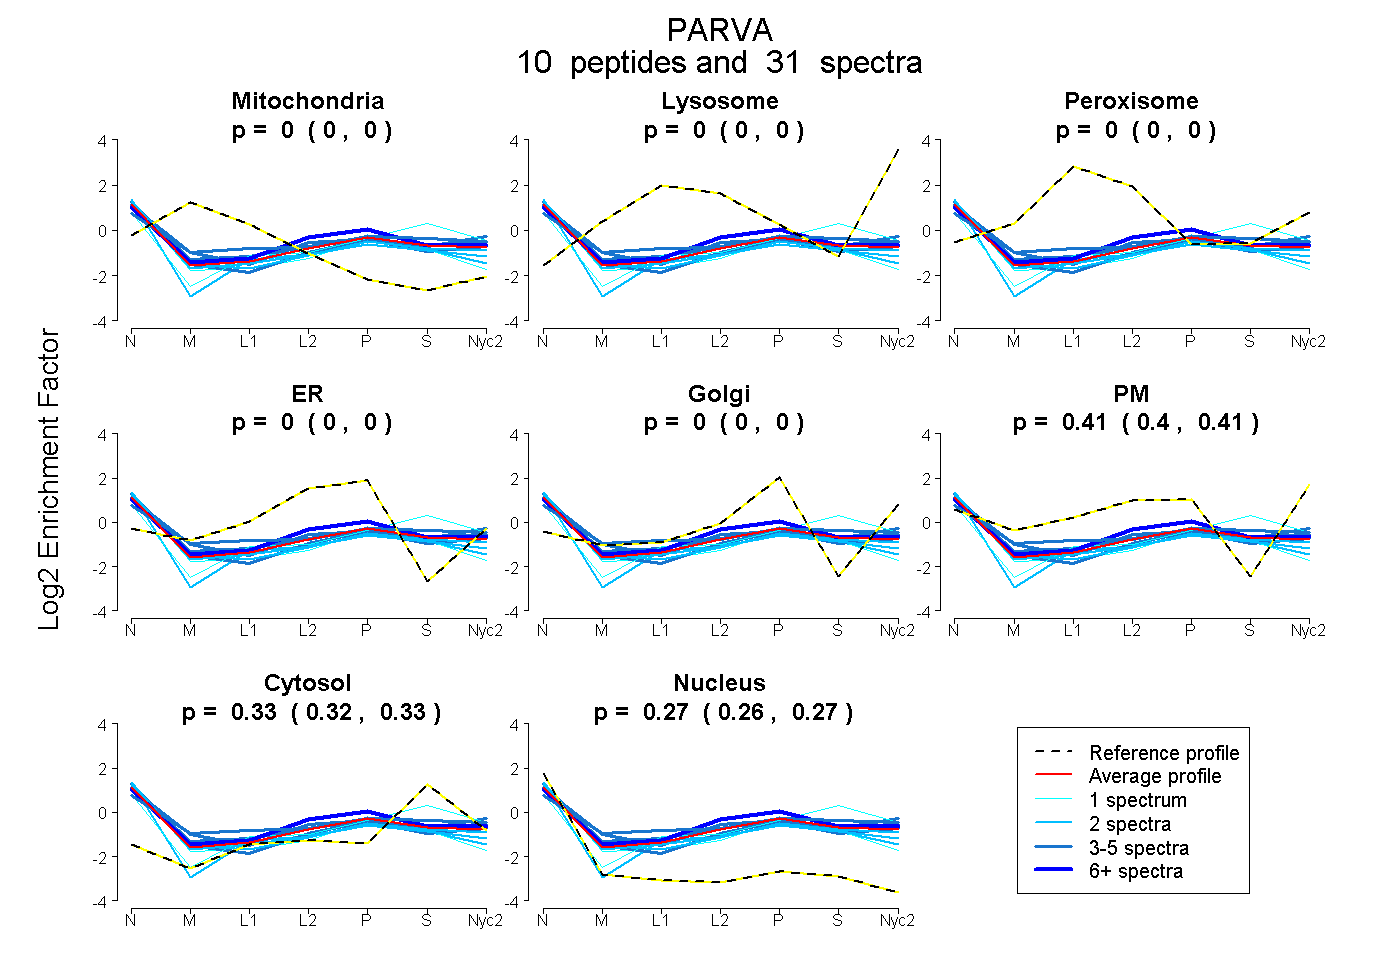
| Plot | Mito | Lyso | Perox | ER | Golgi | PM | Cytosol | Nucleus | |||||
| Expt A |
10 peptides |
31 spectra |
|
0.000 0.000 | 0.000 |
0.000 0.000 | 0.000 |
0.000 0.000 | 0.000 |
0.000 0.000 | 0.000 |
0.000 0.000 | 0.000 |
0.406 0.400 | 0.411 |
0.325 0.319 | 0.331 |
0.269 0.263 | 0.273 |
| 5 spectra, VLYNLFTK | 0.018 | 0.000 | 0.076 | 0.000 | 0.000 | 0.373 | 0.355 | 0.179 | ||
| 1 spectrum, LNVAEVTQSEIAQK | 0.000 | 0.000 | 0.000 | 0.155 | 0.000 | 0.168 | 0.281 | 0.396 | ||
| 4 spectra, LQEIMK | 0.000 | 0.000 | 0.000 | 0.000 | 0.000 | 0.404 | 0.262 | 0.334 | ||
| 2 spectra, QIQEEITGNTEALSGR | 0.000 | 0.000 | 0.005 | 0.000 | 0.000 | 0.352 | 0.279 | 0.363 | ||
| 1 spectrum, SPSVPK | 0.000 | 0.000 | 0.000 | 0.000 | 0.000 | 0.284 | 0.568 | 0.149 | ||
| 3 spectra, EGILQSR | 0.000 | 0.000 | 0.000 | 0.000 | 0.000 | 0.465 | 0.310 | 0.225 | ||
| 8 spectra, TMVDPNSR | 0.000 | 0.000 | 0.000 | 0.100 | 0.000 | 0.376 | 0.317 | 0.207 | ||
| 2 spectra, TLITFVNK | 0.000 | 0.000 | 0.000 | 0.000 | 0.000 | 0.369 | 0.293 | 0.338 | ||
| 3 spectra, LQTVLEK | 0.000 | 0.000 | 0.000 | 0.000 | 0.000 | 0.451 | 0.306 | 0.242 | ||
| 2 spectra, DAFDTLFDHAPDK | 0.000 | 0.000 | 0.000 | 0.171 | 0.000 | 0.150 | 0.315 | 0.364 |
| Plot | Mito | Lyso or Perox | ER | Golgi | PM | Cytosol | Nucleus | ||||||
| Expt B |
3 peptides |
4 spectra |
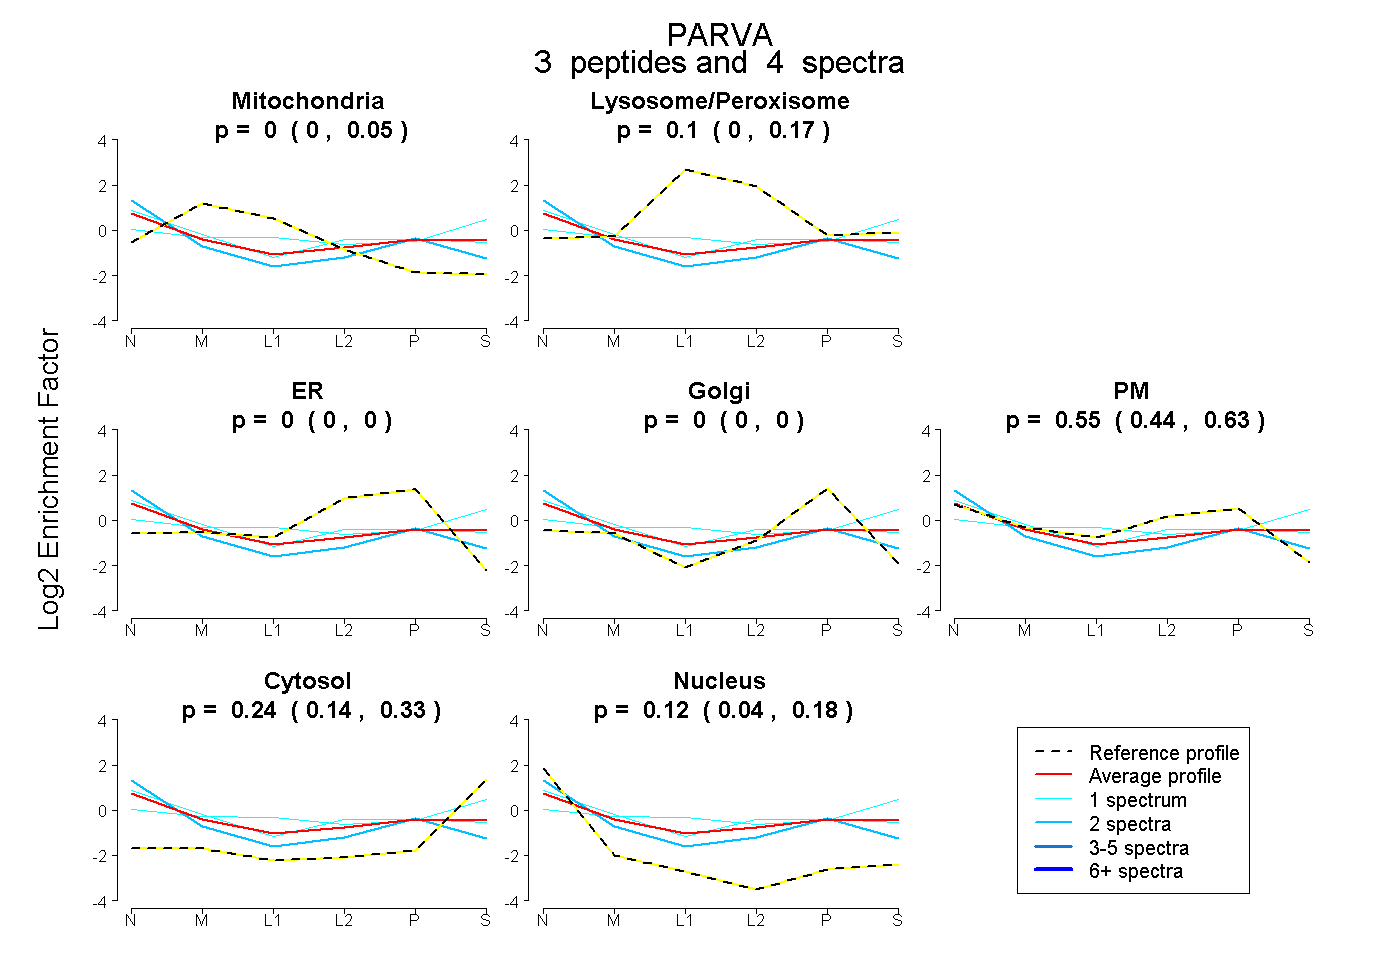 |
0.000 0.000 | 0.052 |
0.095 0.000 | 0.171 |
0.000 0.000 | 0.000 |
0.000 0.000 | 0.000 |
0.550 0.443 | 0.630 |
0.237 0.142 | 0.325 |
0.118 0.040 | 0.177 |
|||
| Plot | Lyso | Other | |||||||||||
| Expt C |
10 peptides |
19 spectra |
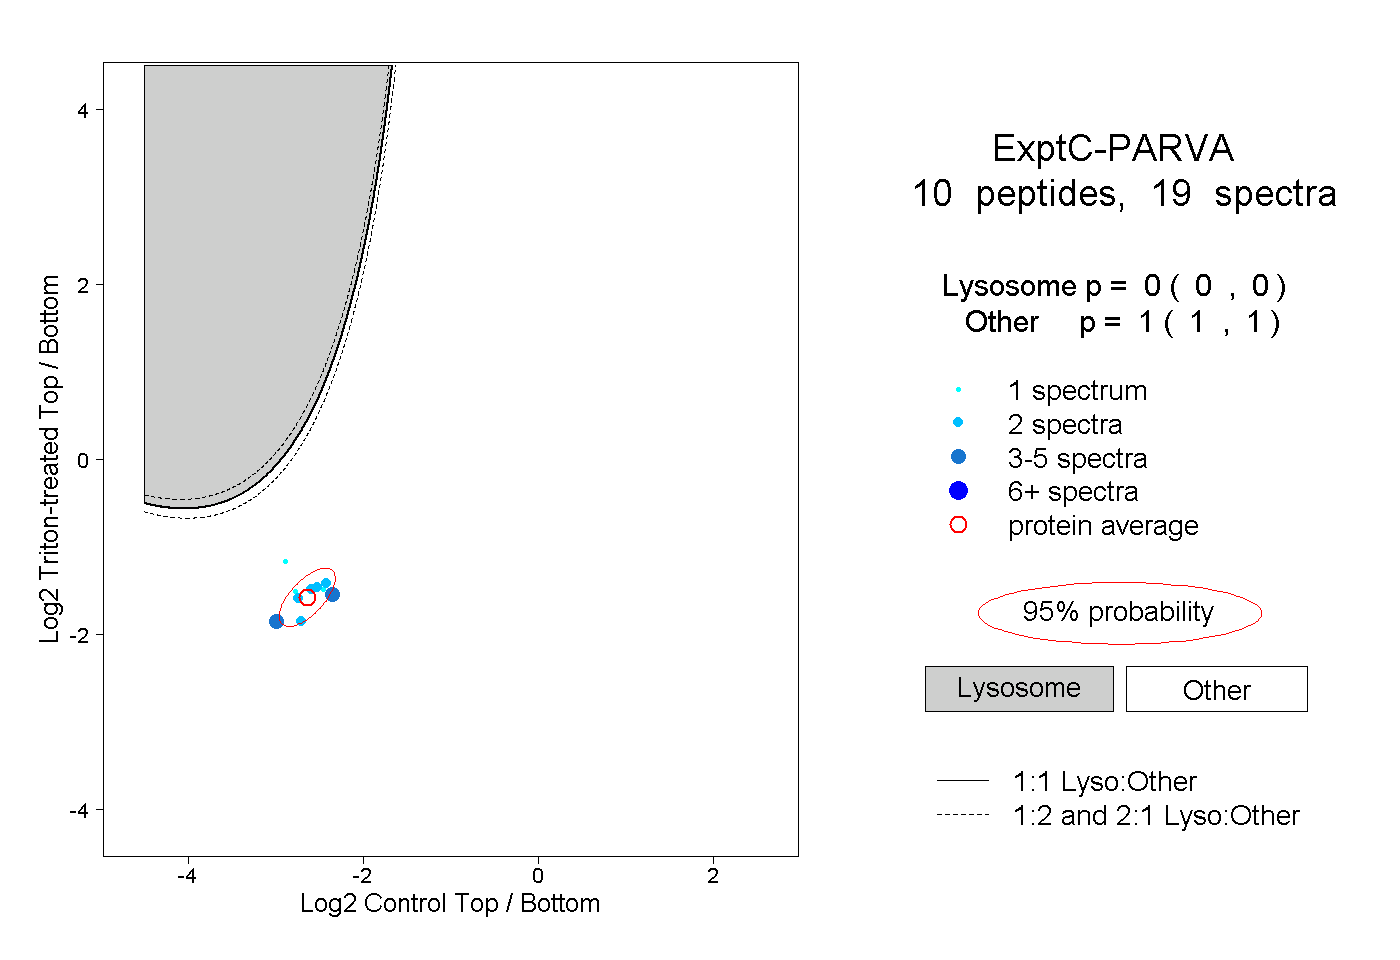 |
0.000 0.000 | 0.000 |
1.000 1.000 | 1.000 |
||||||||
| Plot | Lyso | Other | |||||||||||
| Expt D |
2 peptides |
3 spectra |
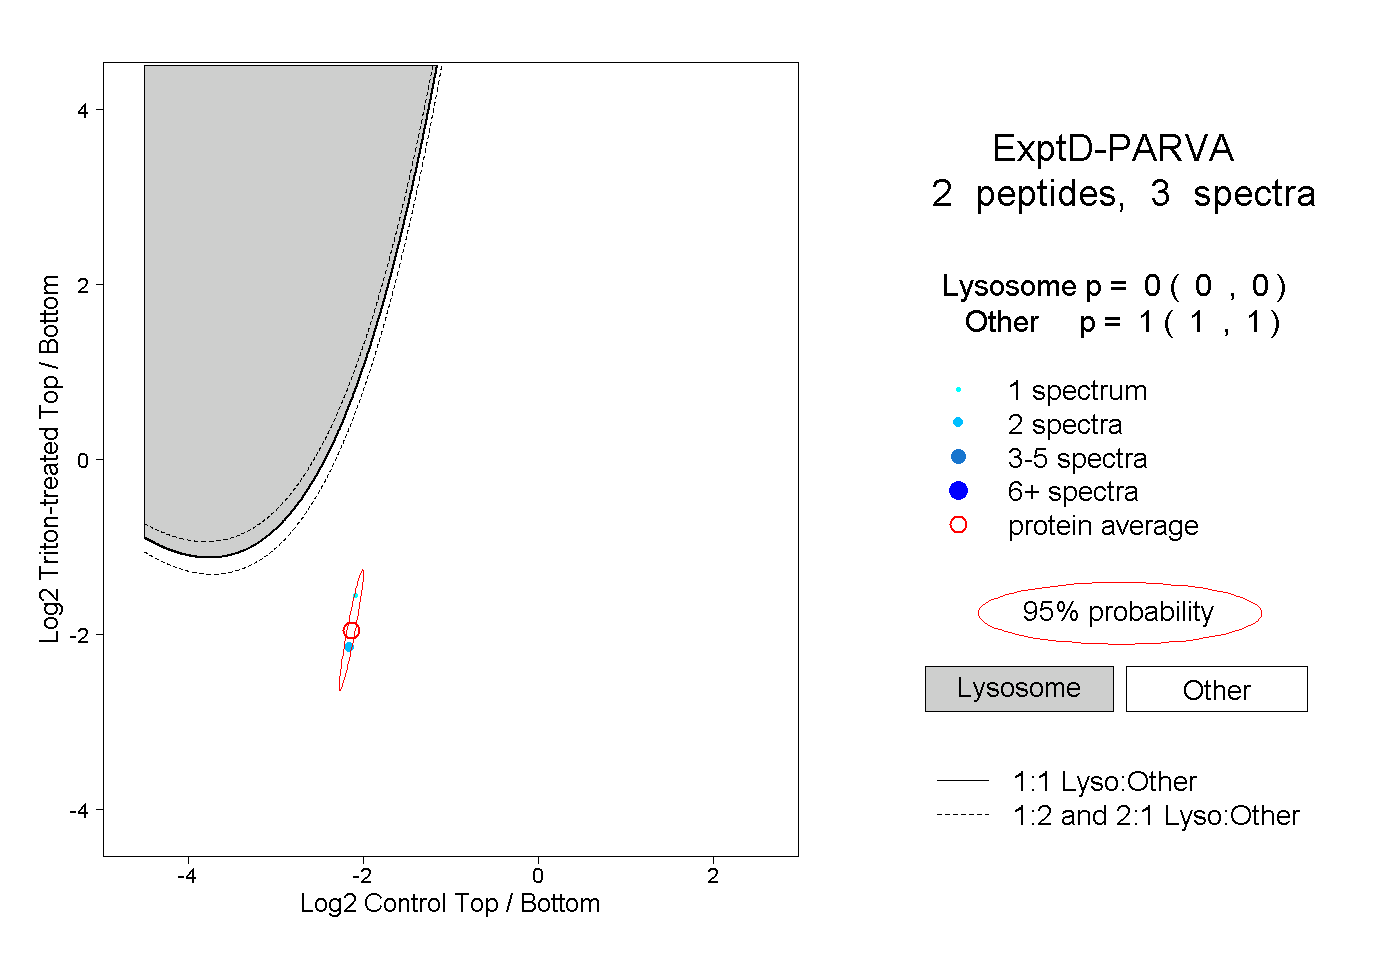 |
0.000 0.000 | 0.000 |
1.000 1.000 | 1.000 |