9
9peptides
spectra
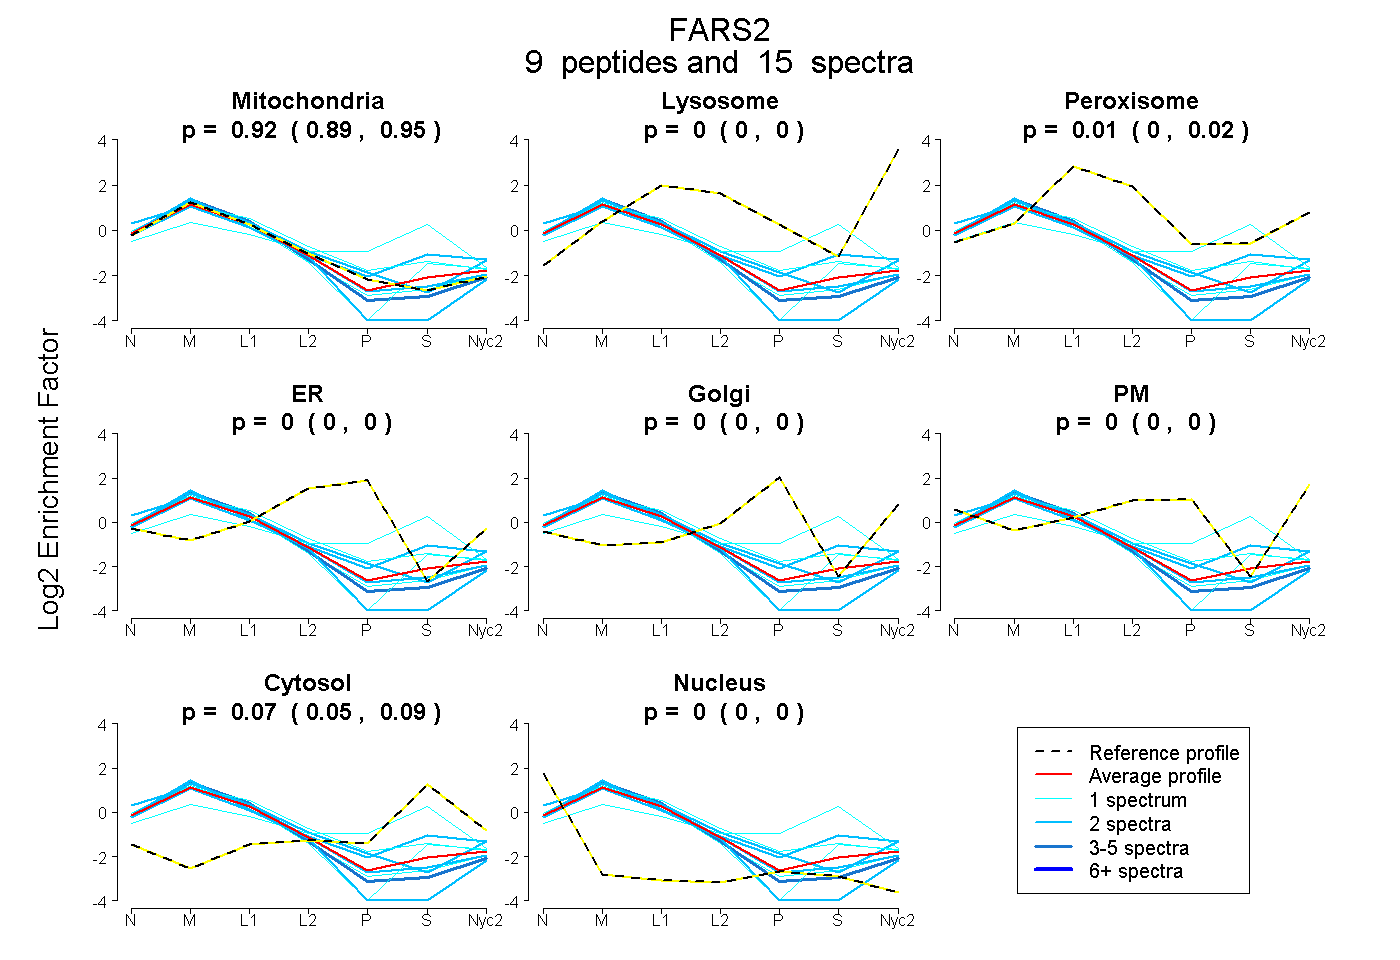
0.894 | 0.946
0.000 | 0.000
0.000 | 0.018
0.000 | 0.000
0.000 | 0.000
0.000 | 0.000
0.047 | 0.087
0.000 | 0.000
4peptides
spectra
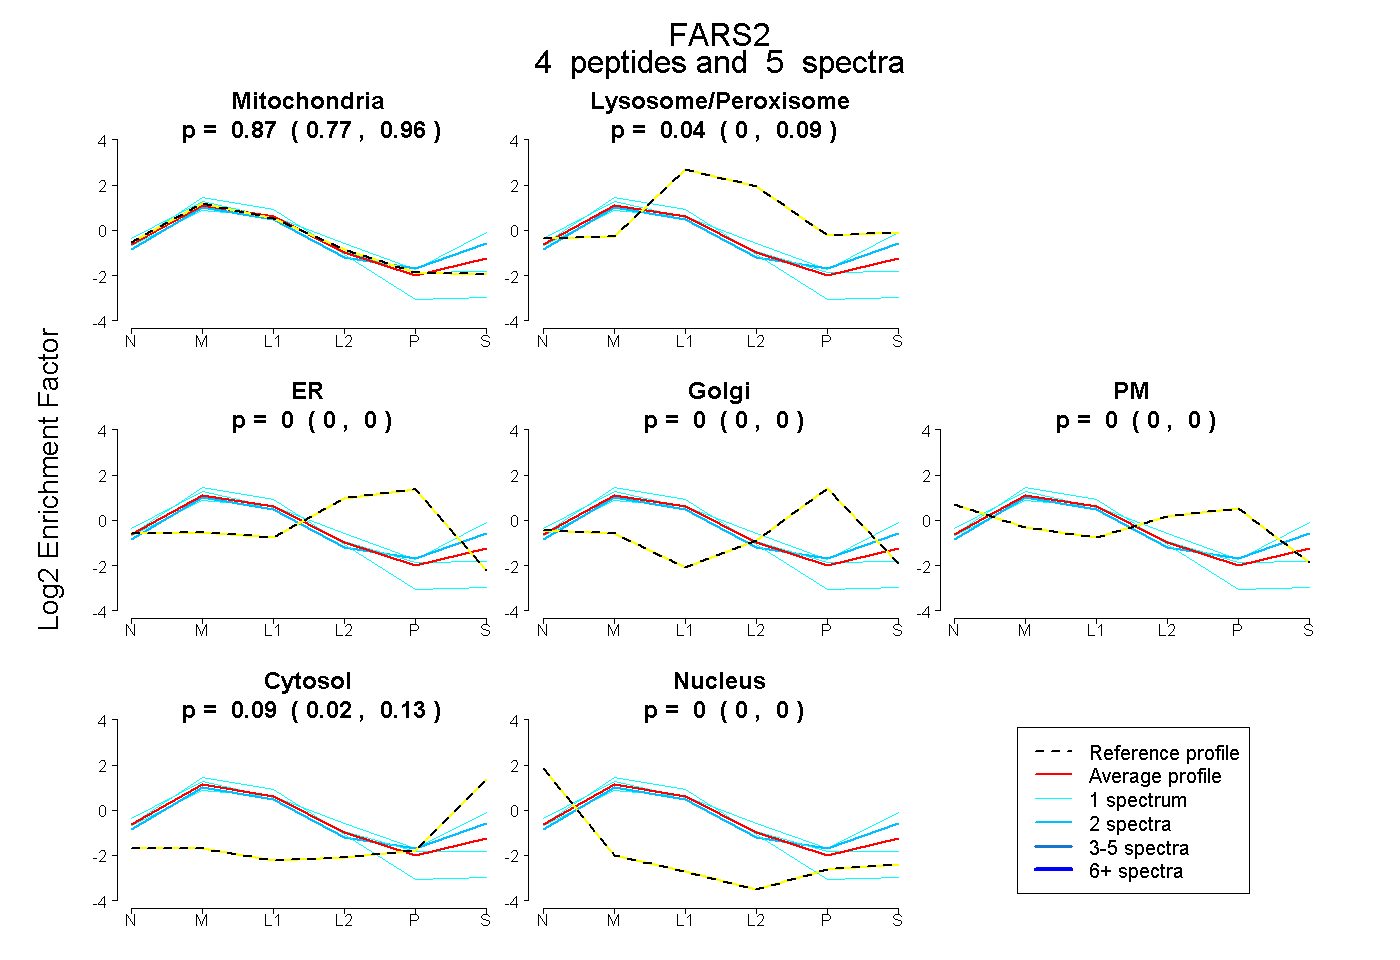
0.770 | 0.959
0.000 | 0.088
0.000 | 0.000
0.000 | 0.000
0.000 | 0.000
0.023 | 0.135
0.000 | 0.000