 9
9peptides
spectra
0.894 | 0.946
0.000 | 0.000
0.000 | 0.018
0.000 | 0.000
0.000 | 0.000
0.000 | 0.000
0.047 | 0.087
0.000 | 0.000
| Plot | Mito | Lyso | Perox | ER | Golgi | PM | Cytosol | Nucleus | |||||
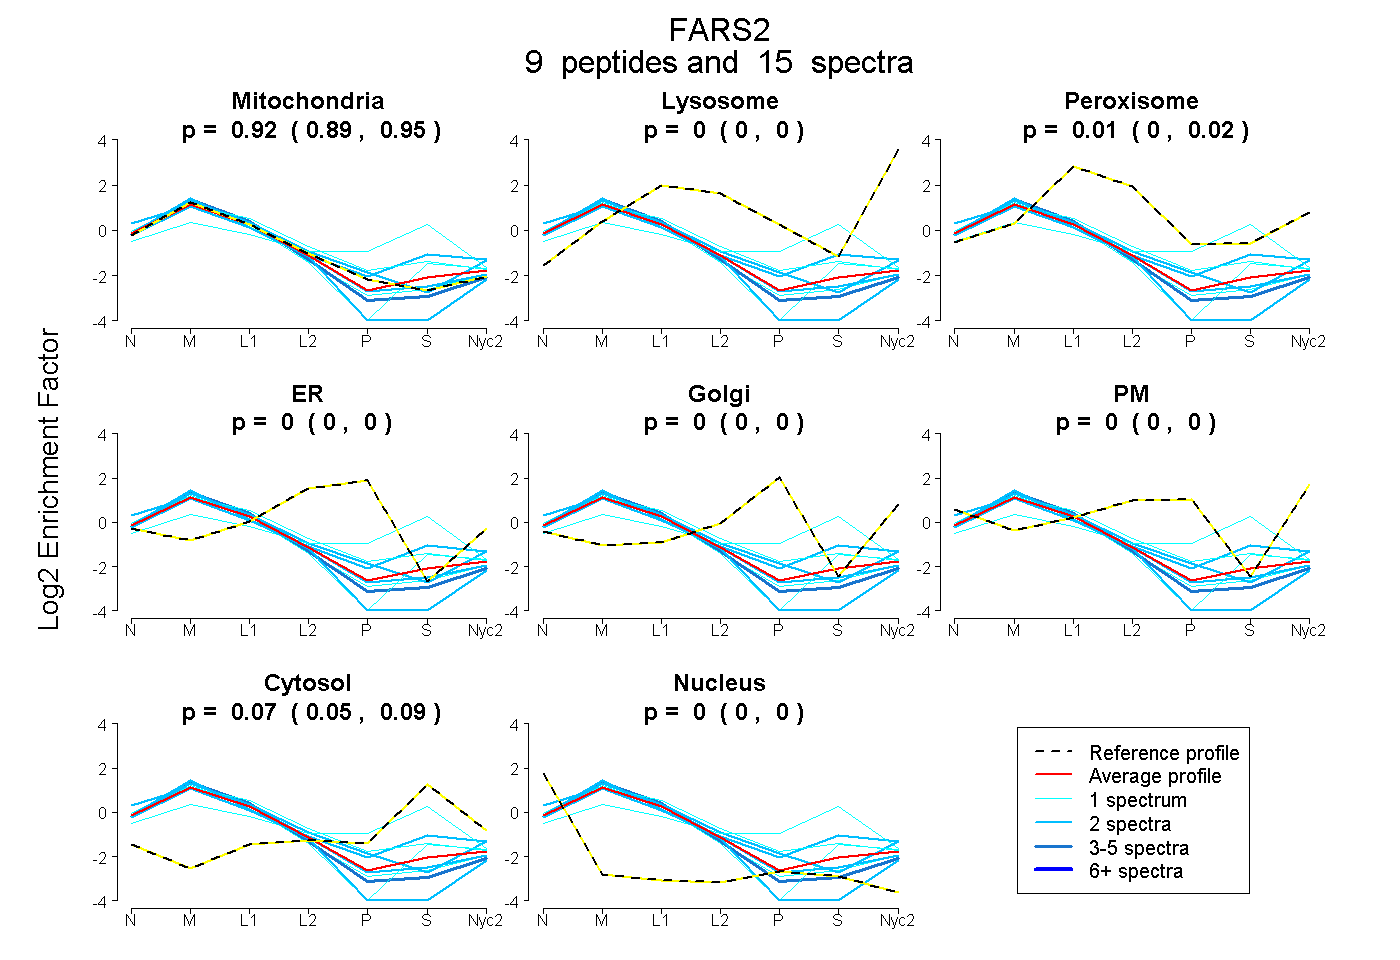
| Expt A |
9 peptides |
15 spectra |
|
0.923 0.894 | 0.946 |
0.000 0.000 | 0.000 |
0.007 0.000 | 0.018 |
0.000 0.000 | 0.000 |
0.000 0.000 | 0.000 |
0.000 0.000 | 0.000 |
0.069 0.047 | 0.087 |
0.000 0.000 | 0.000 |
| 1 spectrum, LVEFDLK | 0.893 | 0.000 | 0.000 | 0.000 | 0.000 | 0.000 | 0.107 | 0.000 | ||
| 2 spectra, LSDINQSVK | 0.933 | 0.000 | 0.016 | 0.000 | 0.000 | 0.000 | 0.000 | 0.051 | ||
| 1 spectrum, DGESLQLFEESSR | 0.983 | 0.000 | 0.000 | 0.000 | 0.000 | 0.000 | 0.000 | 0.017 | ||
| 2 spectra, VLELLGK | 0.960 | 0.000 | 0.000 | 0.000 | 0.000 | 0.000 | 0.000 | 0.040 | ||
| 2 spectra, LFWSEDER | 0.711 | 0.006 | 0.085 | 0.000 | 0.000 | 0.000 | 0.198 | 0.000 | ||
| 2 spectra, LAMVLYDIPDIR | 0.884 | 0.052 | 0.000 | 0.000 | 0.000 | 0.064 | 0.000 | 0.000 | ||
| 1 spectrum, LVTHLFGDGLEVR | 0.435 | 0.000 | 0.130 | 0.000 | 0.000 | 0.000 | 0.435 | 0.000 | ||
| 1 spectrum, SYPQDDHTNLTQK | 0.746 | 0.000 | 0.151 | 0.000 | 0.000 | 0.000 | 0.103 | 0.000 | ||
| 3 spectra, FHPLWLIK | 0.988 | 0.000 | 0.000 | 0.000 | 0.000 | 0.000 | 0.000 | 0.012 |
| Plot | Mito | Lyso or Perox | ER | Golgi | PM | Cytosol | Nucleus | ||||||
| Expt B |
4 peptides |
5 spectra |
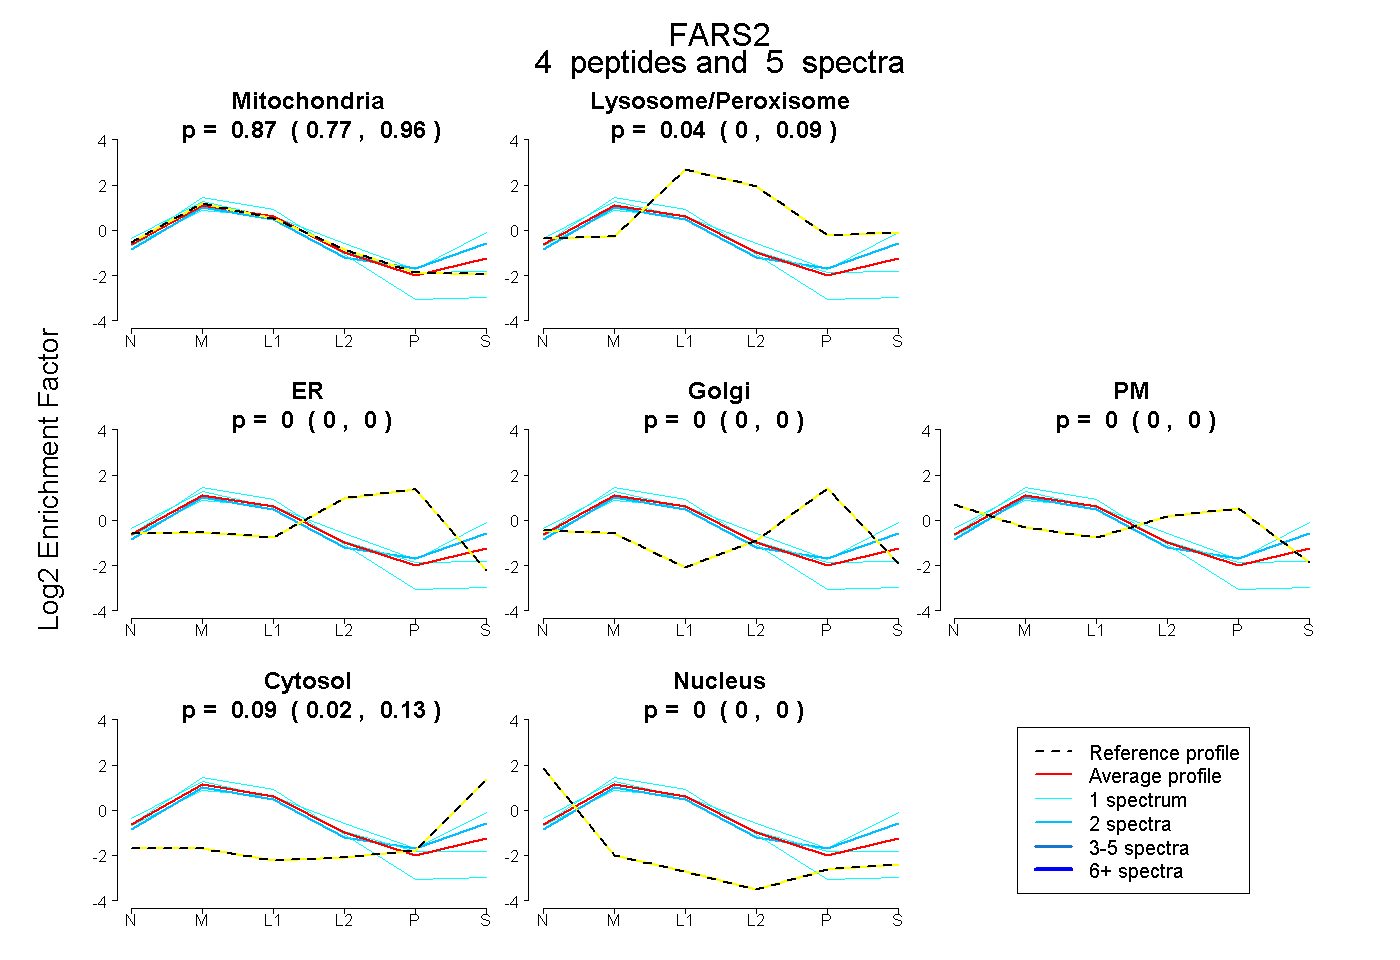 |
0.875 0.770 | 0.959 |
0.040 0.000 | 0.088 |
0.000 0.000 | 0.000 |
0.000 0.000 | 0.000 |
0.000 0.000 | 0.000 |
0.085 0.023 | 0.135 |
0.000 0.000 | 0.000 |
|||
| Plot | Lyso | Other | |||||||||||
| Expt C |
15 peptides |
52 spectra |
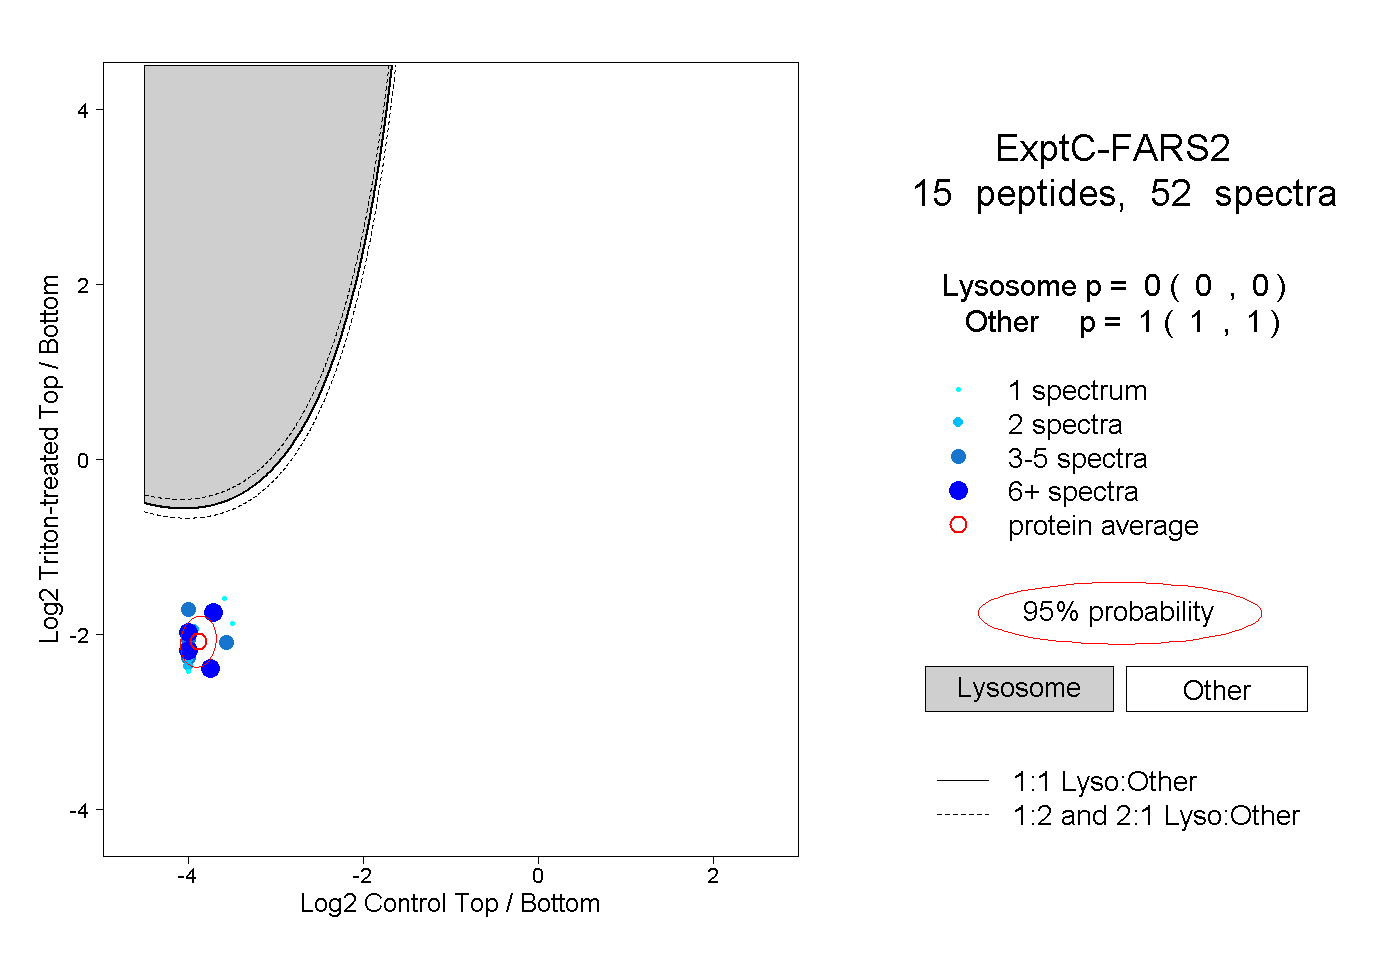 |
0.000 0.000 | 0.000 |
1.000 1.000 | 1.000 |
||||||||
| Plot | Lyso | Other | |||||||||||
| Expt D |
2 peptides |
2 spectra |
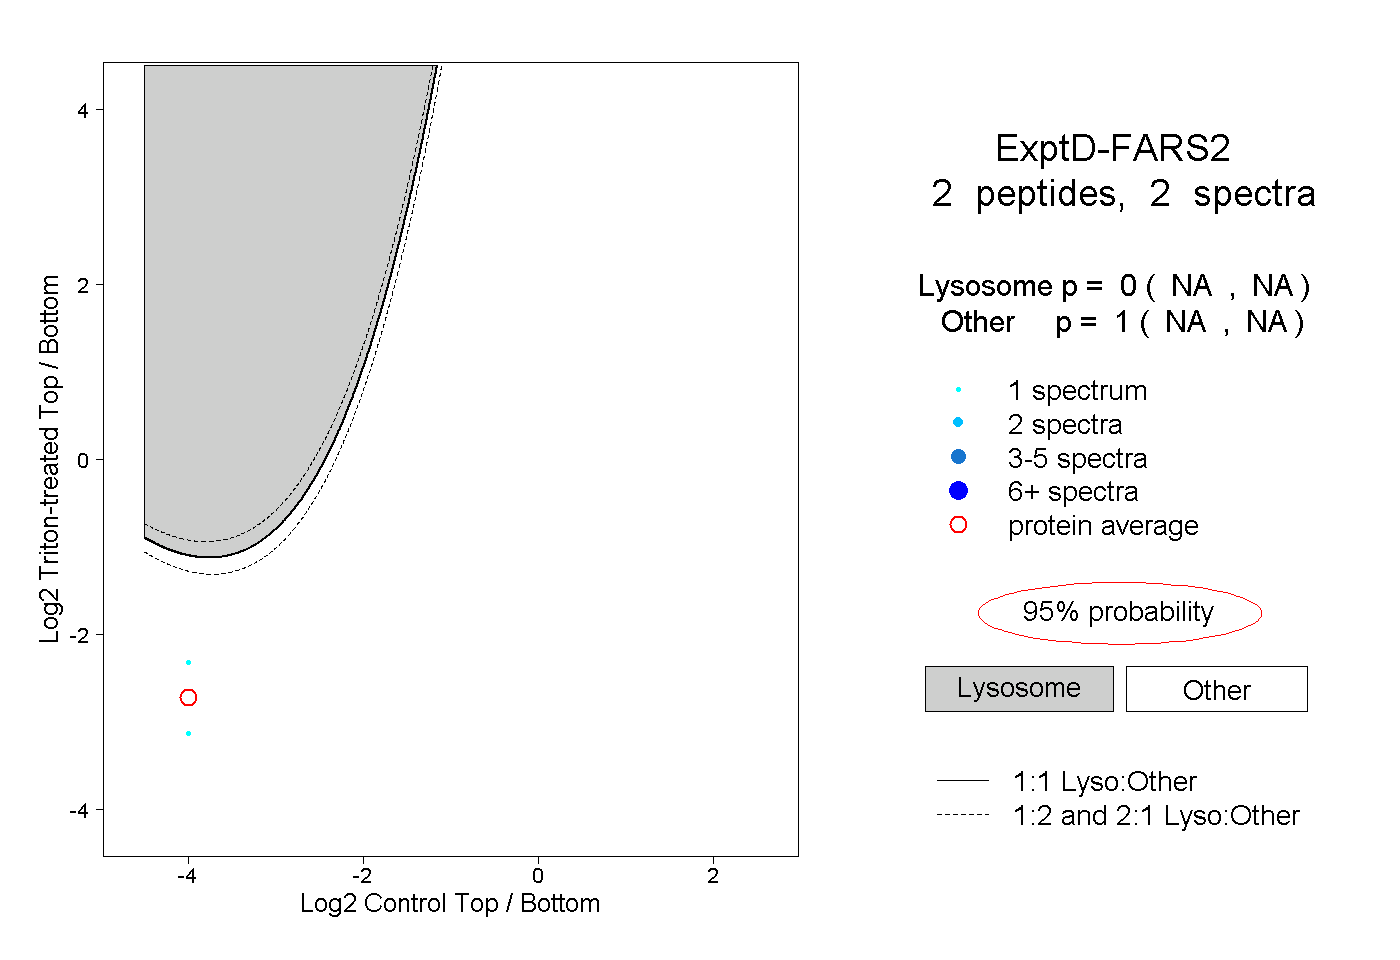 |
0.000 NA | NA |
1.000 NA | NA |