14
14peptides
spectra
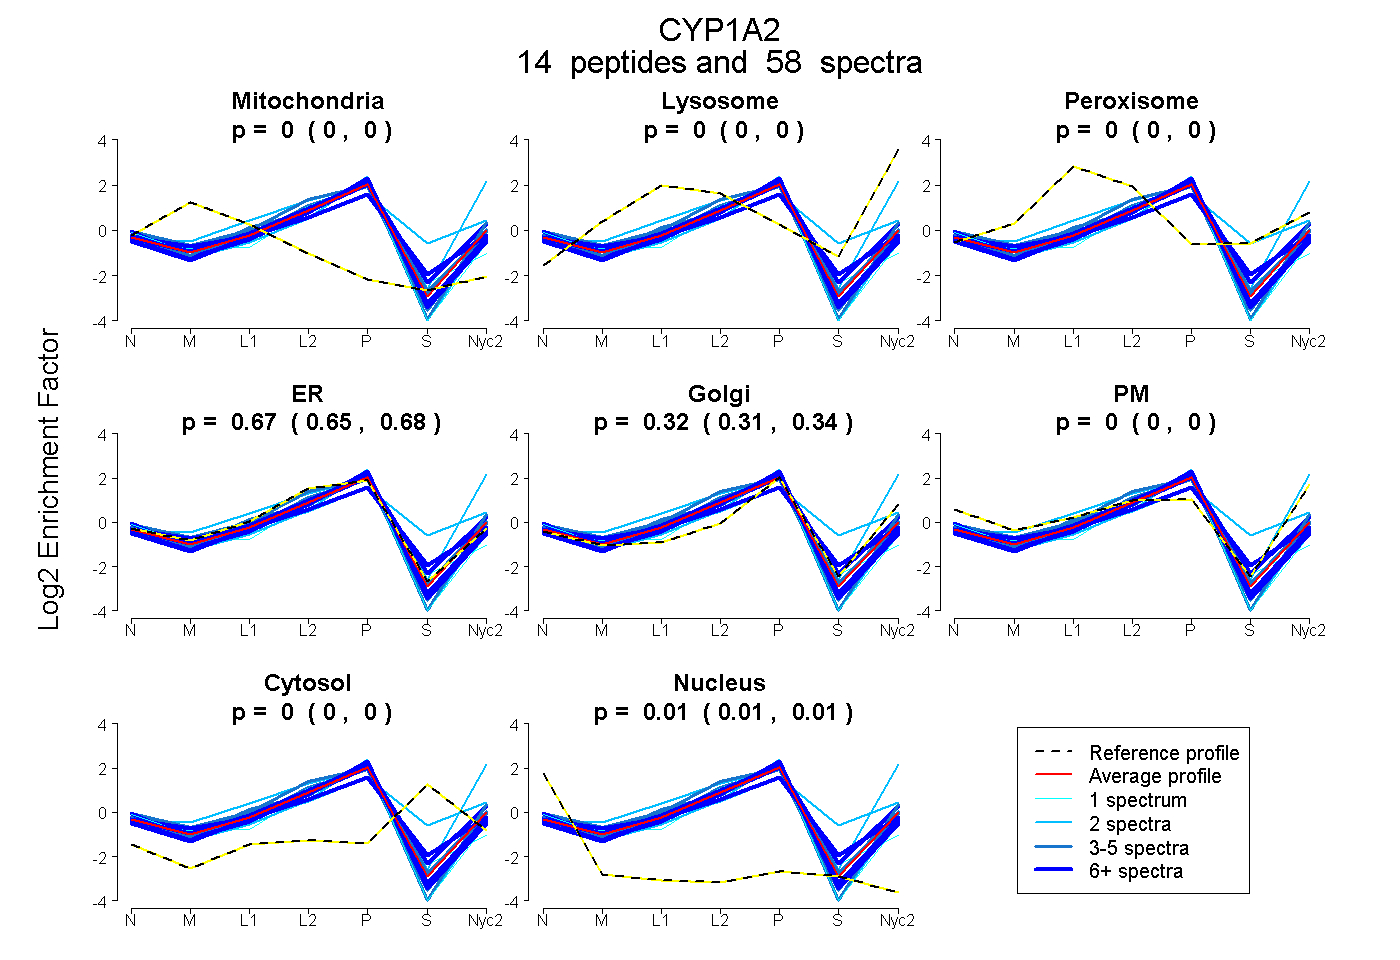
0.000 | 0.000
0.000 | 0.000
0.000 | 0.000
0.653 | 0.676
0.309 | 0.336
0.000 | 0.000
0.000 | 0.000
0.008 | 0.014
10peptides
spectra
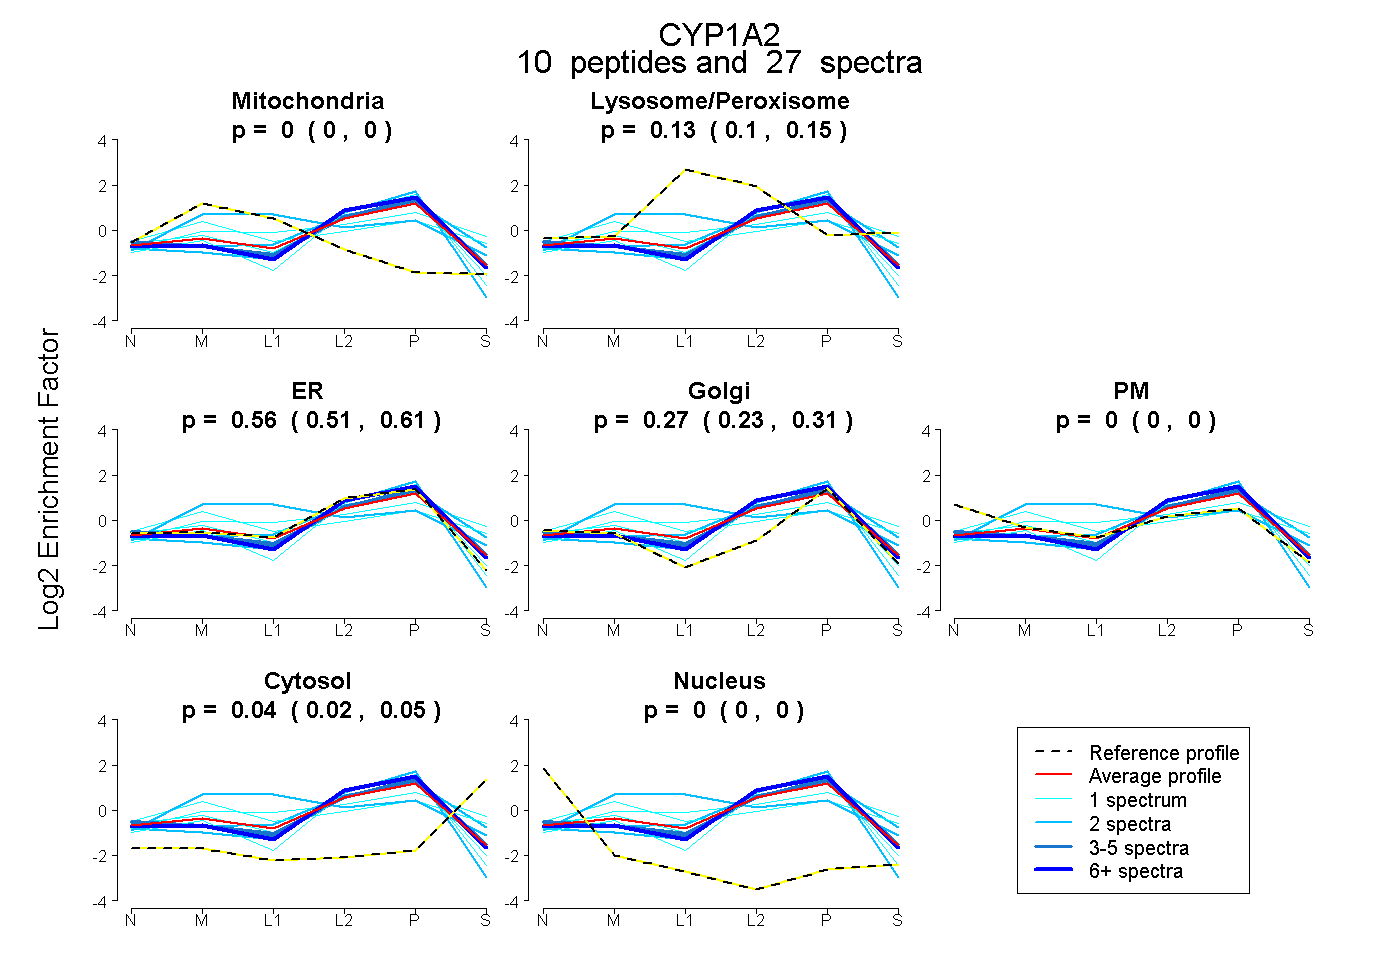
0.000 | 0.000
0.099 | 0.147
0.509 | 0.607
0.228 | 0.308
0.000 | 0.000
0.023 | 0.055
0.000 | 0.000