 4
4peptides
spectra
0.000 | 0.028
0.000 | 0.000
0.000 | 0.038
0.000 | 0.041
0.000 | 0.035
0.000 | 0.045
0.551 | 0.624
0.330 | 0.419
1peptide
spectrum
NA | NA
NA | NA
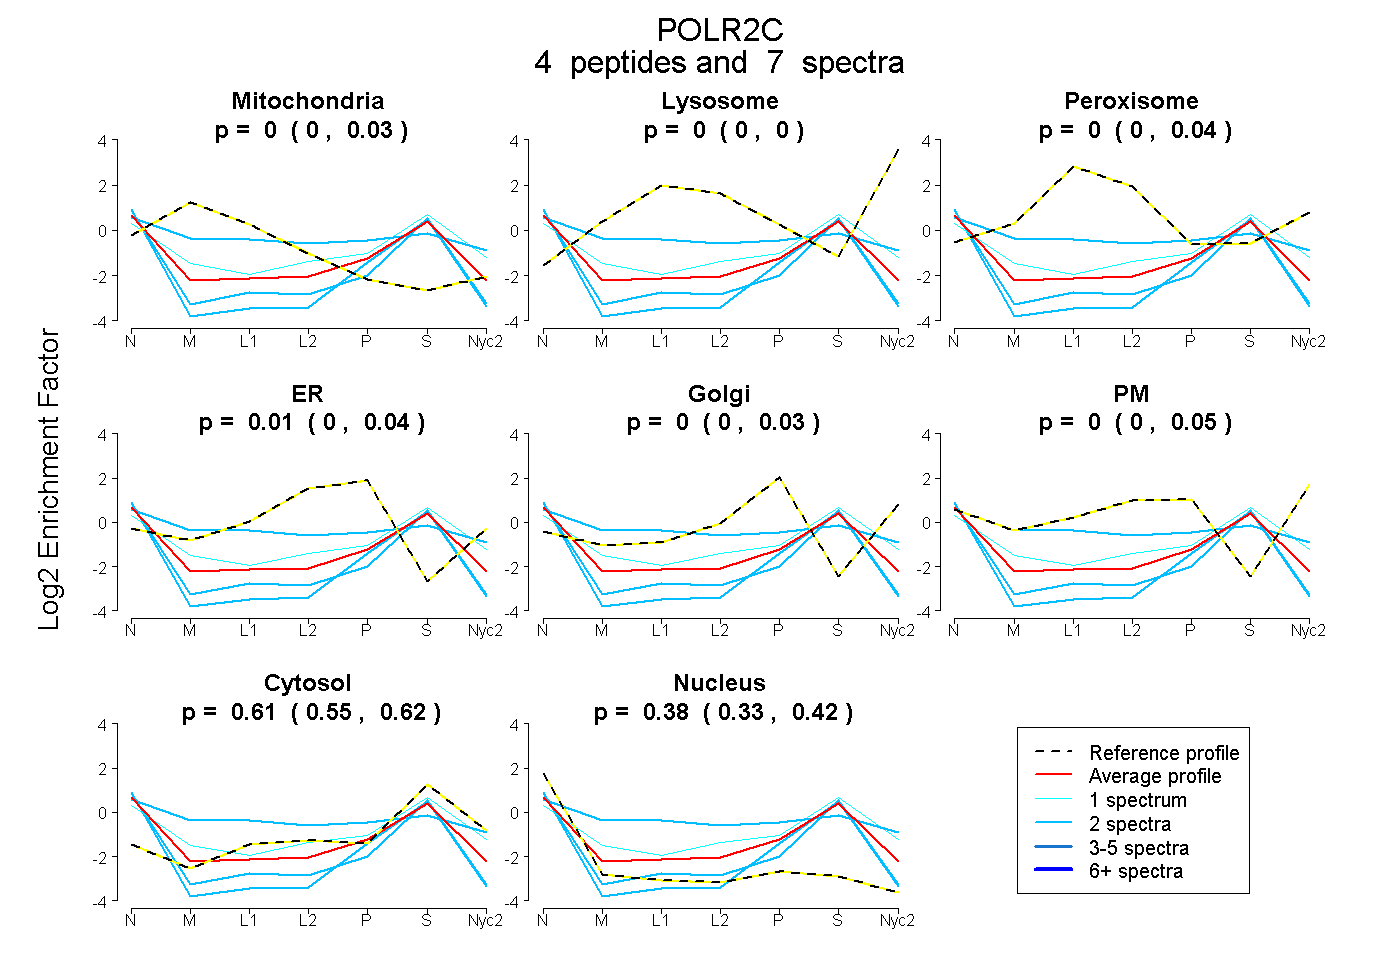
| Plot | Mito | Lyso | Perox | ER | Golgi | PM | Cytosol | Nucleus | |||||
| Expt A |
4 peptides |
7 spectra |
|
0.000 0.000 | 0.028 |
0.000 0.000 | 0.000 |
0.000 0.000 | 0.038 |
0.015 0.000 | 0.041 |
0.000 0.000 | 0.035 |
0.000 0.000 | 0.045 |
0.605 0.551 | 0.624 |
0.380 0.330 | 0.419 |
||
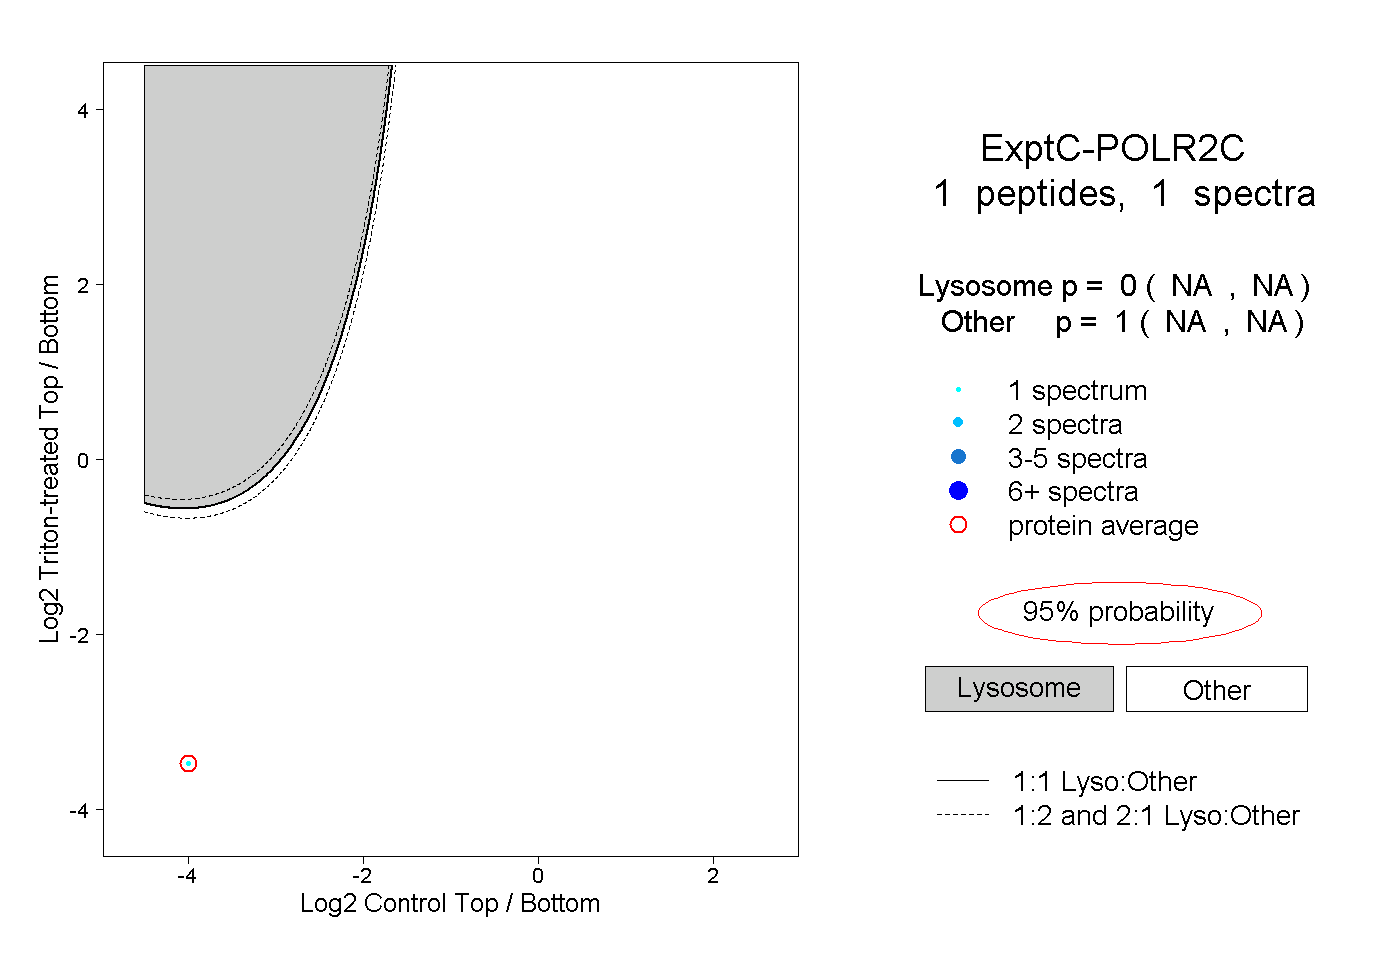
| Plot | Lyso | Other | |||||||||||
| Expt C |
1 peptide |
1 spectrum |
|
0.000 NA | NA |
1.000 NA | NA |