15
15peptides
spectra
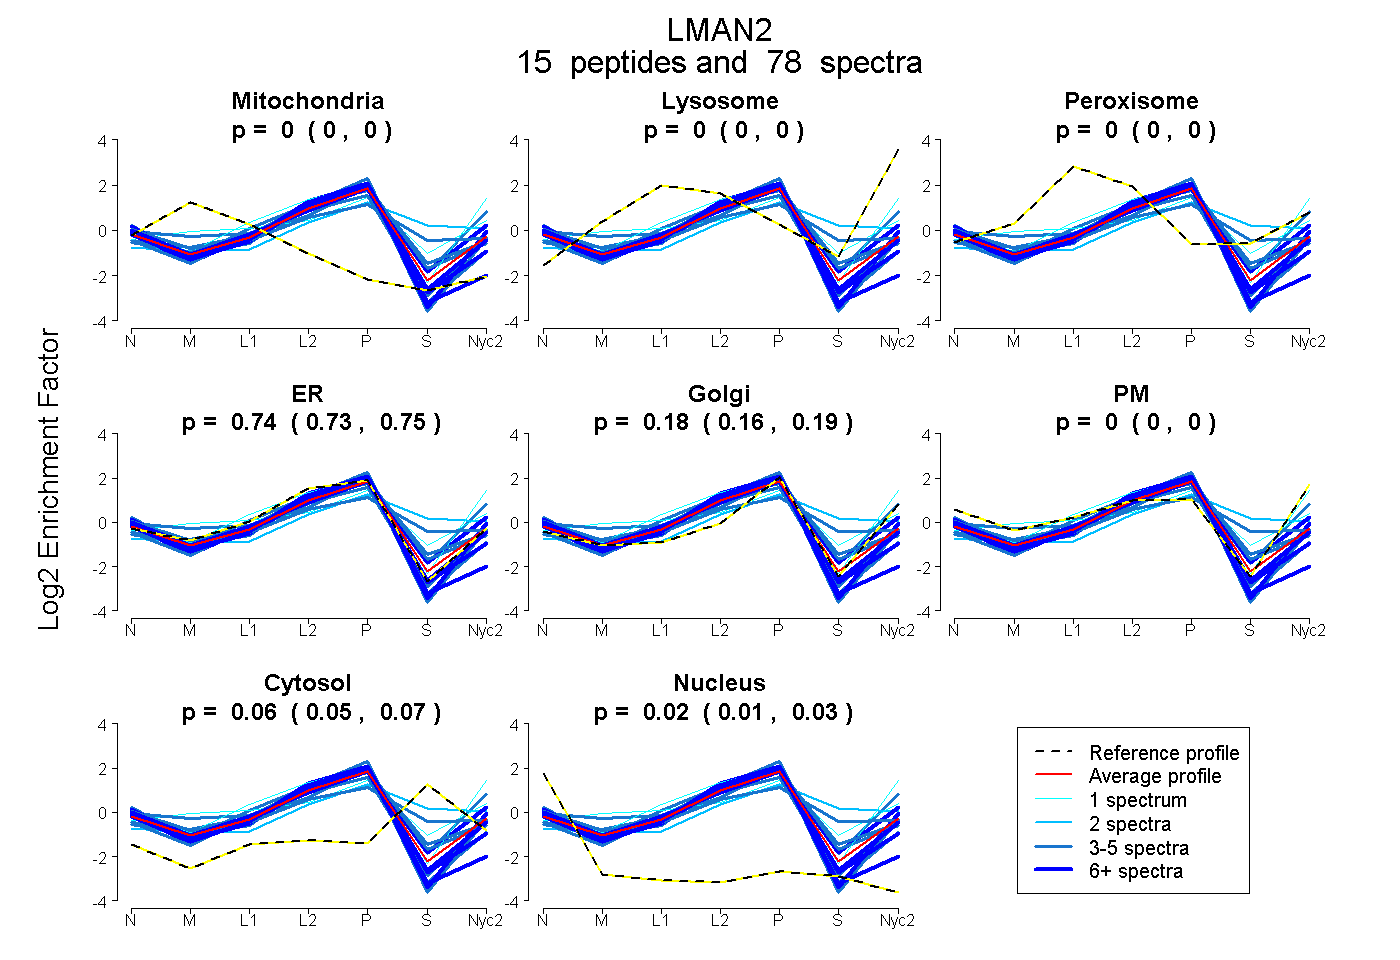
0.000 | 0.000
0.000 | 0.000
0.000 | 0.000
0.730 | 0.753
0.160 | 0.189
0.000 | 0.000
0.050 | 0.072
0.014 | 0.026
9peptides
spectra
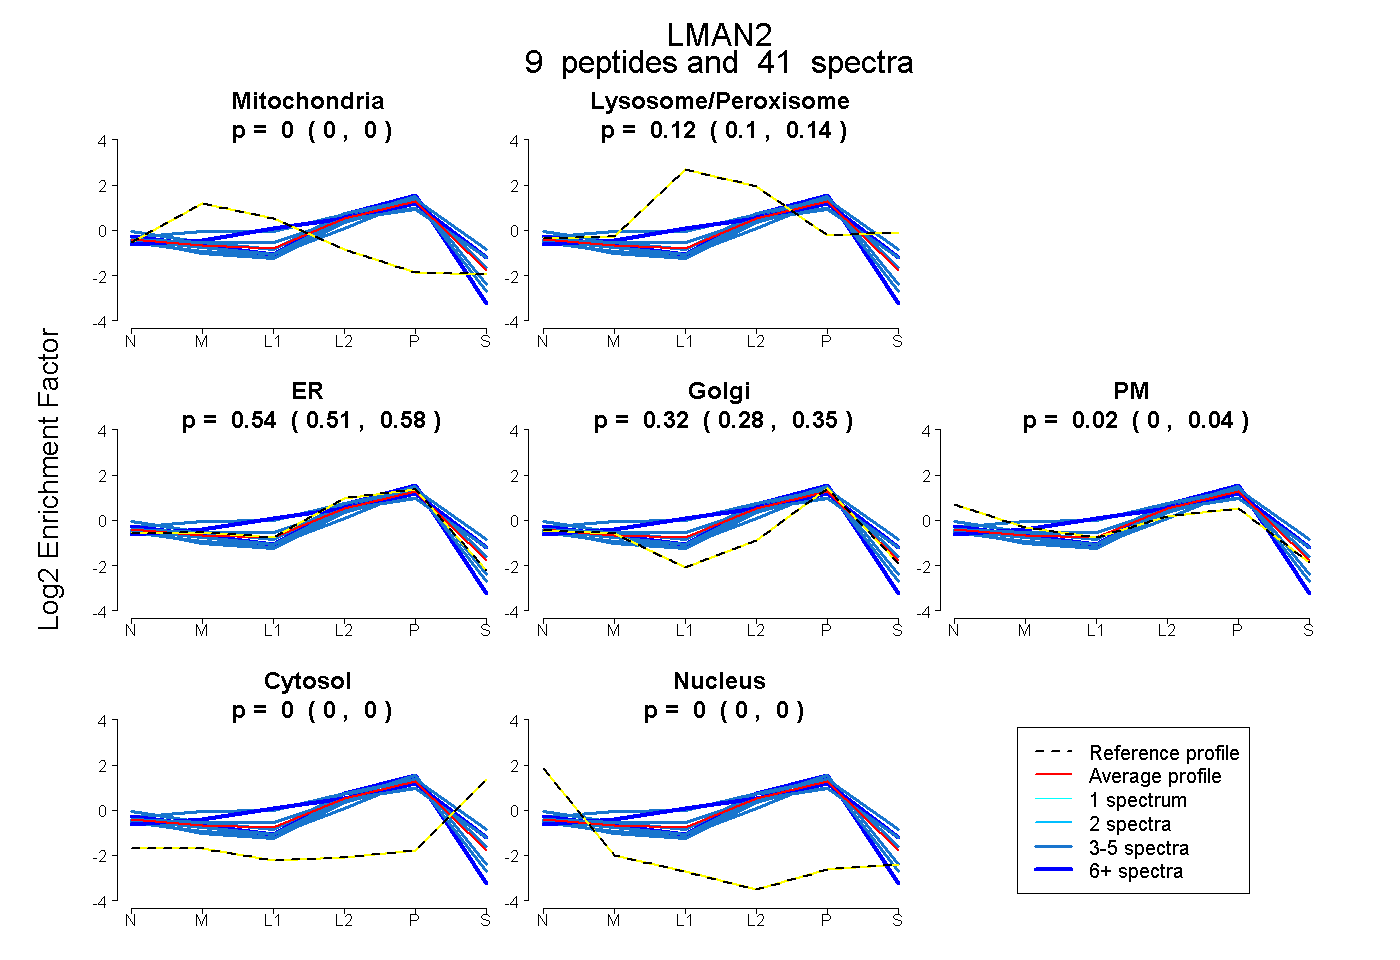
0.000 | 0.000
0.095 | 0.137
0.506 | 0.578
0.279 | 0.348
0.000 | 0.038
0.000 | 0.002
0.000 | 0.000