 3
3peptides
spectra
0.114 | 0.208
0.000 | 0.147
0.207 | 0.428
0.000 | 0.055
0.000 | 0.000
0.326 | 0.498
0.000 | 0.000
0.000 | 0.000
3peptides
spectra
0.024 | 0.289
0.704 | 0.976
| Plot | Mito | Lyso | Perox | ER | Golgi | PM | Cytosol | Nucleus | |||||
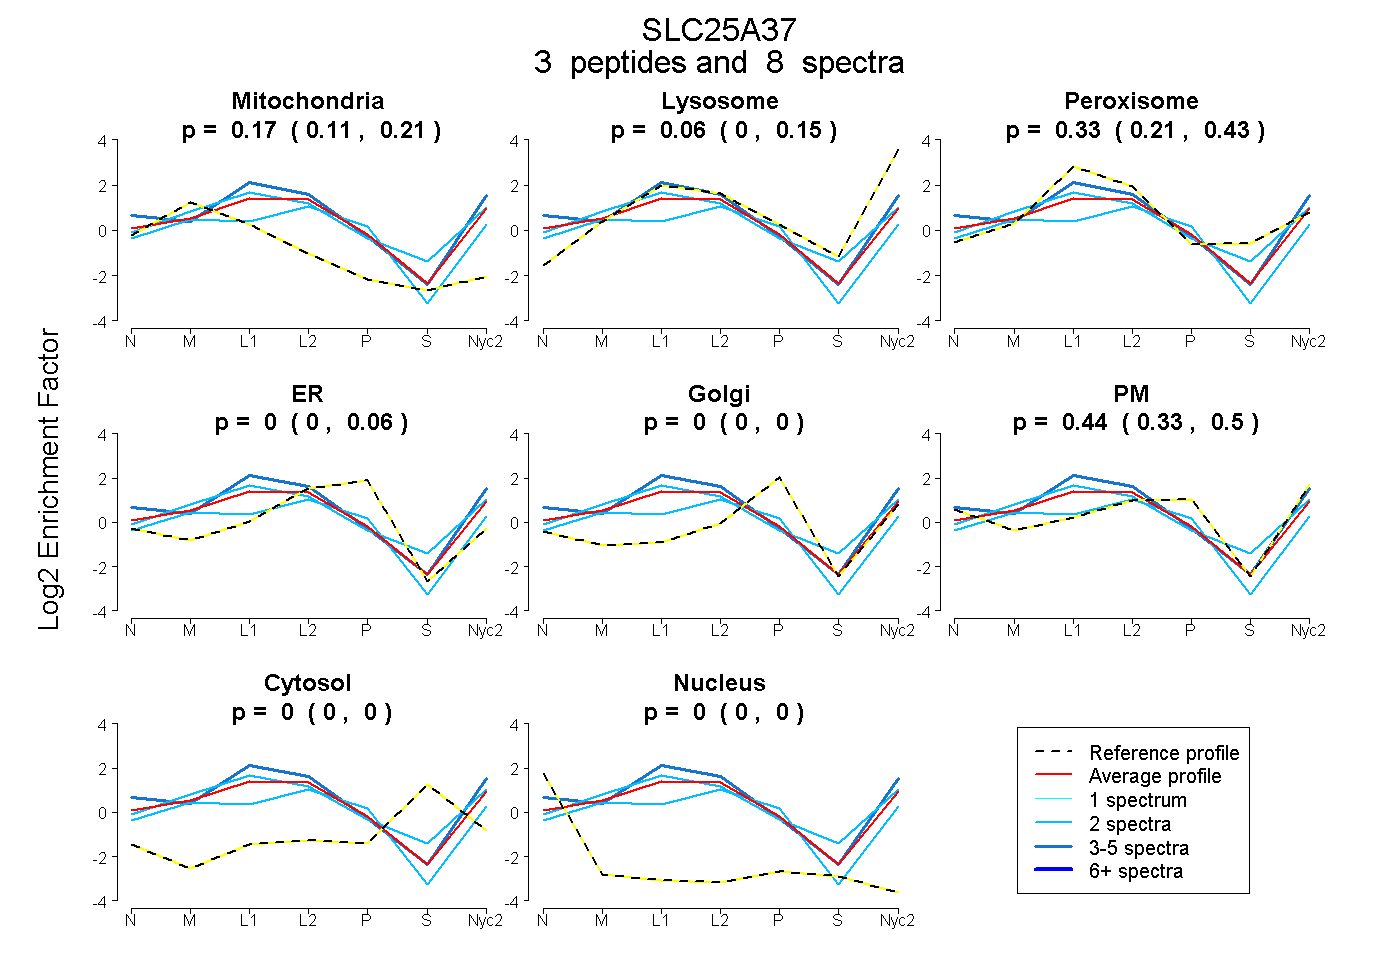
| Expt A |
3 peptides |
8 spectra |
|
0.168 0.114 | 0.208 |
0.063 0.000 | 0.147 |
0.333 0.207 | 0.428 |
0.000 0.000 | 0.055 |
0.000 0.000 | 0.000 |
0.436 0.326 | 0.498 |
0.000 0.000 | 0.000 |
0.000 0.000 | 0.000 |
||
| Plot | Lyso | Other | |||||||||||
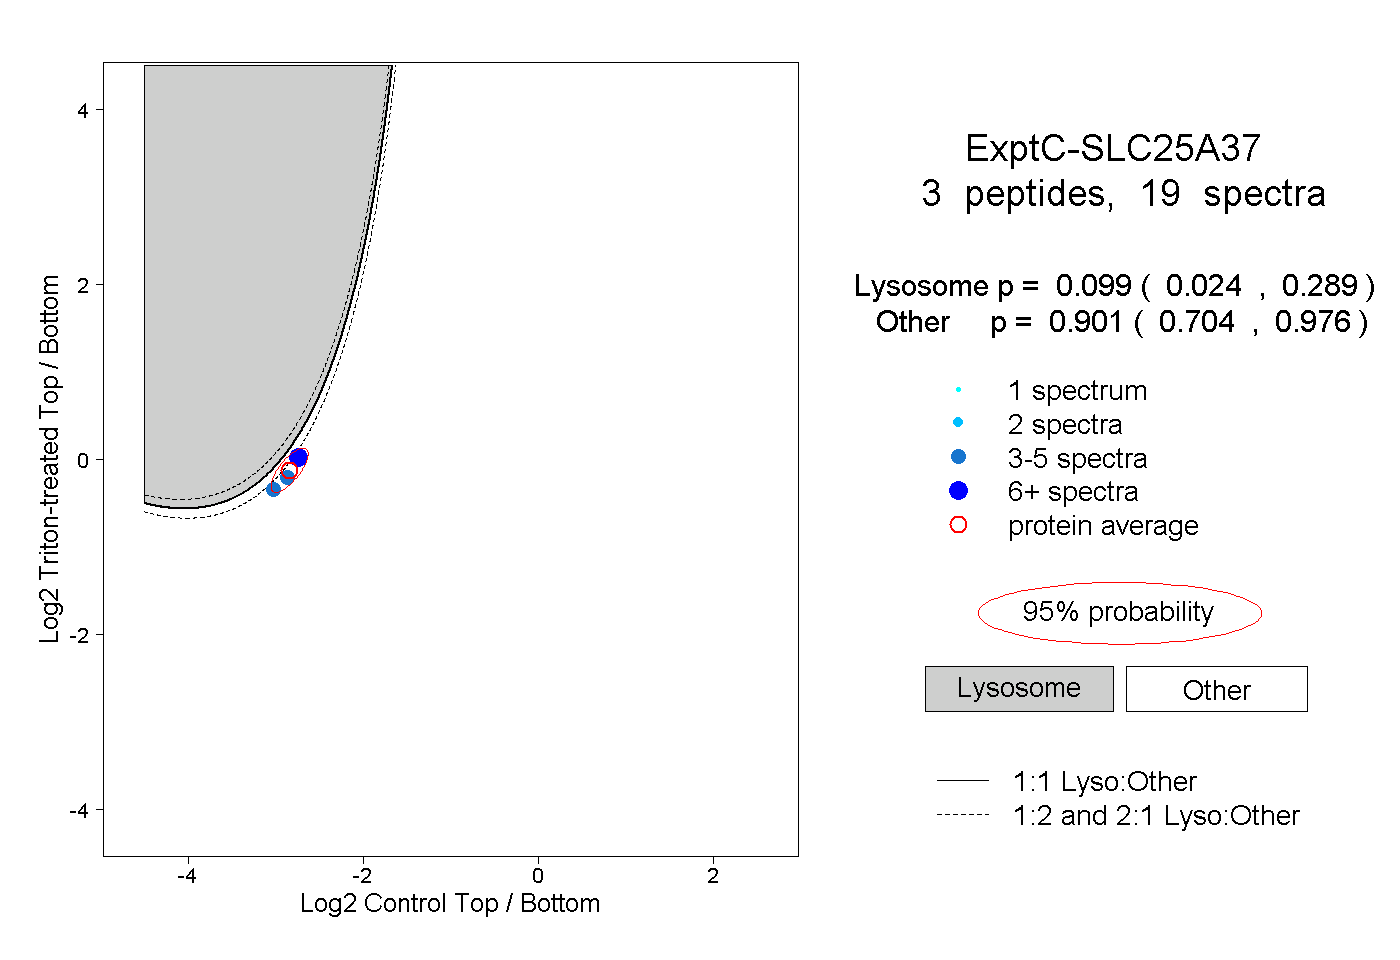
| Expt C |
3 peptides |
19 spectra |
|
0.099 0.024 | 0.289 |
0.901 0.704 | 0.976 |