 14
14peptides
spectra
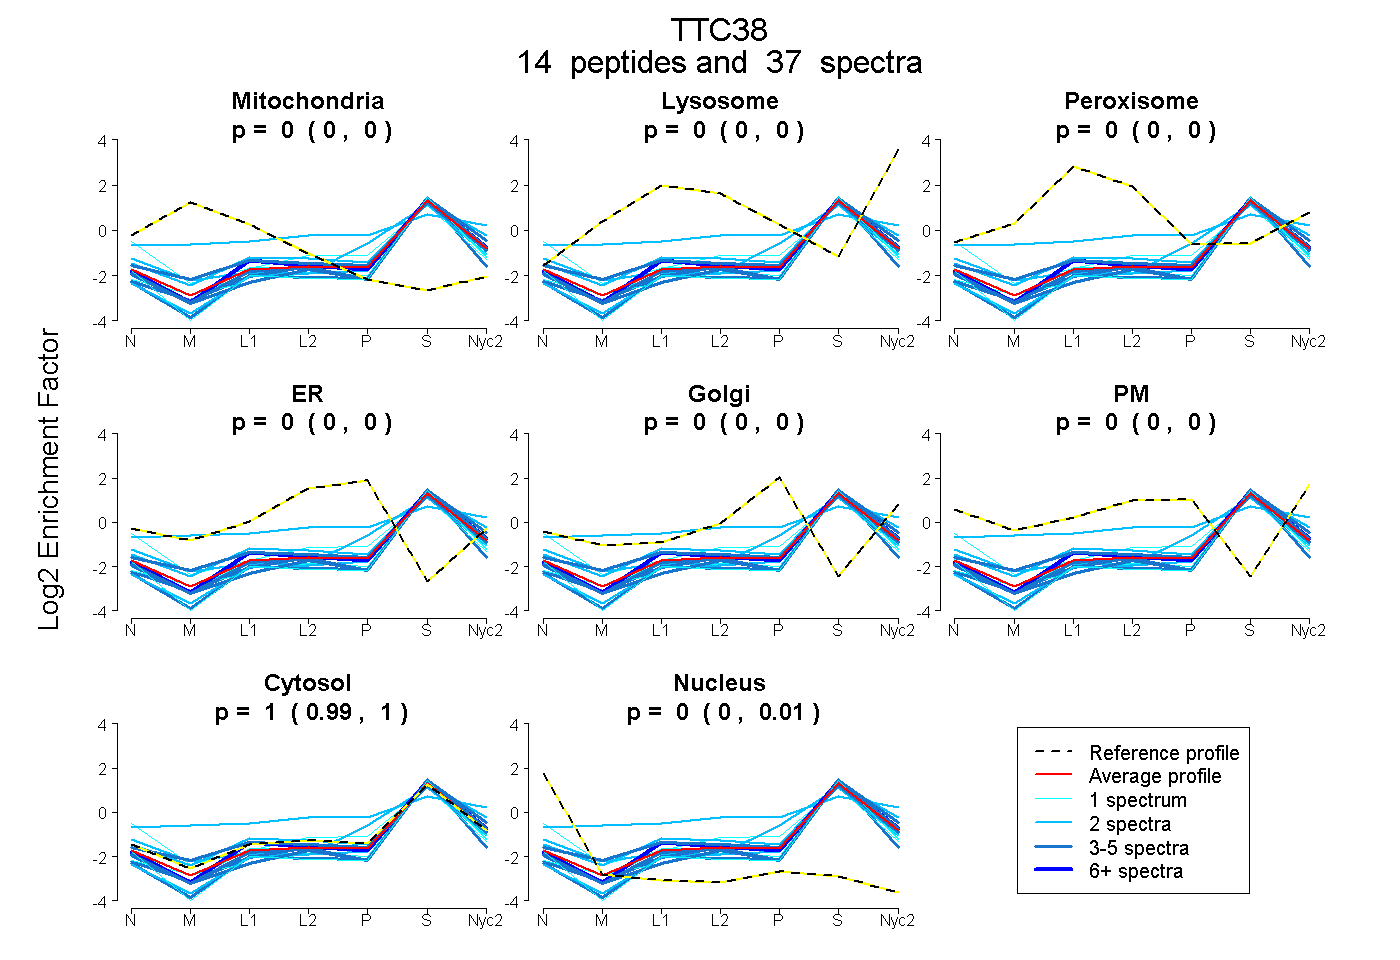
0.000 | 0.000
0.000 | 0.000
0.000 | 0.000
0.000 | 0.000
0.000 | 0.000
0.000 | 0.000
0.990 | 1.000
0.000 | 0.009
| Plot | Mito | Lyso | Perox | ER | Golgi | PM | Cytosol | Nucleus | |||||
| Expt A |
14 peptides |
37 spectra |
|
0.000 0.000 | 0.000 |
0.000 0.000 | 0.000 |
0.000 0.000 | 0.000 |
0.000 0.000 | 0.000 |
0.000 0.000 | 0.000 |
0.000 0.000 | 0.000 |
0.996 0.990 | 1.000 |
0.004 0.000 | 0.009 |
| 2 spectra, DCQAWK | 0.000 | 0.000 | 0.000 | 0.000 | 0.068 | 0.000 | 0.883 | 0.049 | ||
| 4 spectra, ACELWEQILR | 0.000 | 0.000 | 0.000 | 0.000 | 0.000 | 0.000 | 0.952 | 0.048 | ||
| 3 spectra, TMVEFSQTQTLTPR | 0.000 | 0.000 | 0.000 | 0.000 | 0.000 | 0.000 | 1.000 | 0.000 | ||
| 1 spectrum, DAGLPLSTTSNEACK | 0.000 | 0.000 | 0.000 | 0.050 | 0.000 | 0.000 | 0.847 | 0.102 | ||
| 1 spectrum, YQIVQIGGSNAQR | 0.000 | 0.000 | 0.000 | 0.000 | 0.000 | 0.000 | 0.930 | 0.070 | ||
| 2 spectra, LFDATLTQYVK | 0.000 | 0.000 | 0.000 | 0.000 | 0.000 | 0.000 | 1.000 | 0.000 | ||
| 3 spectra, SLGGIEGCLSK | 0.049 | 0.000 | 0.000 | 0.000 | 0.000 | 0.000 | 0.951 | 0.000 | ||
| 7 spectra, LQMEGVSLGQR | 0.000 | 0.000 | 0.000 | 0.000 | 0.000 | 0.000 | 1.000 | 0.000 | ||
| 1 spectrum, DVGLPLCQALVEAENGNSDR | 0.000 | 0.000 | 0.000 | 0.000 | 0.000 | 0.000 | 0.971 | 0.029 | ||
| 4 spectra, DLDLAVK | 0.000 | 0.000 | 0.000 | 0.000 | 0.000 | 0.000 | 1.000 | 0.000 | ||
| 2 spectra, LHVSAVEMFAK | 0.008 | 0.086 | 0.167 | 0.000 | 0.063 | 0.123 | 0.553 | 0.000 | ||
| 4 spectra, VIELLLPIR | 0.000 | 0.000 | 0.000 | 0.000 | 0.000 | 0.000 | 0.979 | 0.021 | ||
| 2 spectra, DALKPNSPLTER | 0.000 | 0.068 | 0.000 | 0.000 | 0.000 | 0.000 | 0.932 | 0.000 | ||
| 1 spectrum, GIYSFGLMETNFYDQAQK | 0.000 | 0.000 | 0.000 | 0.000 | 0.000 | 0.000 | 0.970 | 0.030 |
| Plot | Mito | Lyso or Perox | ER | Golgi | PM | Cytosol | Nucleus | ||||||
| Expt B |
4 peptides |
7 spectra |
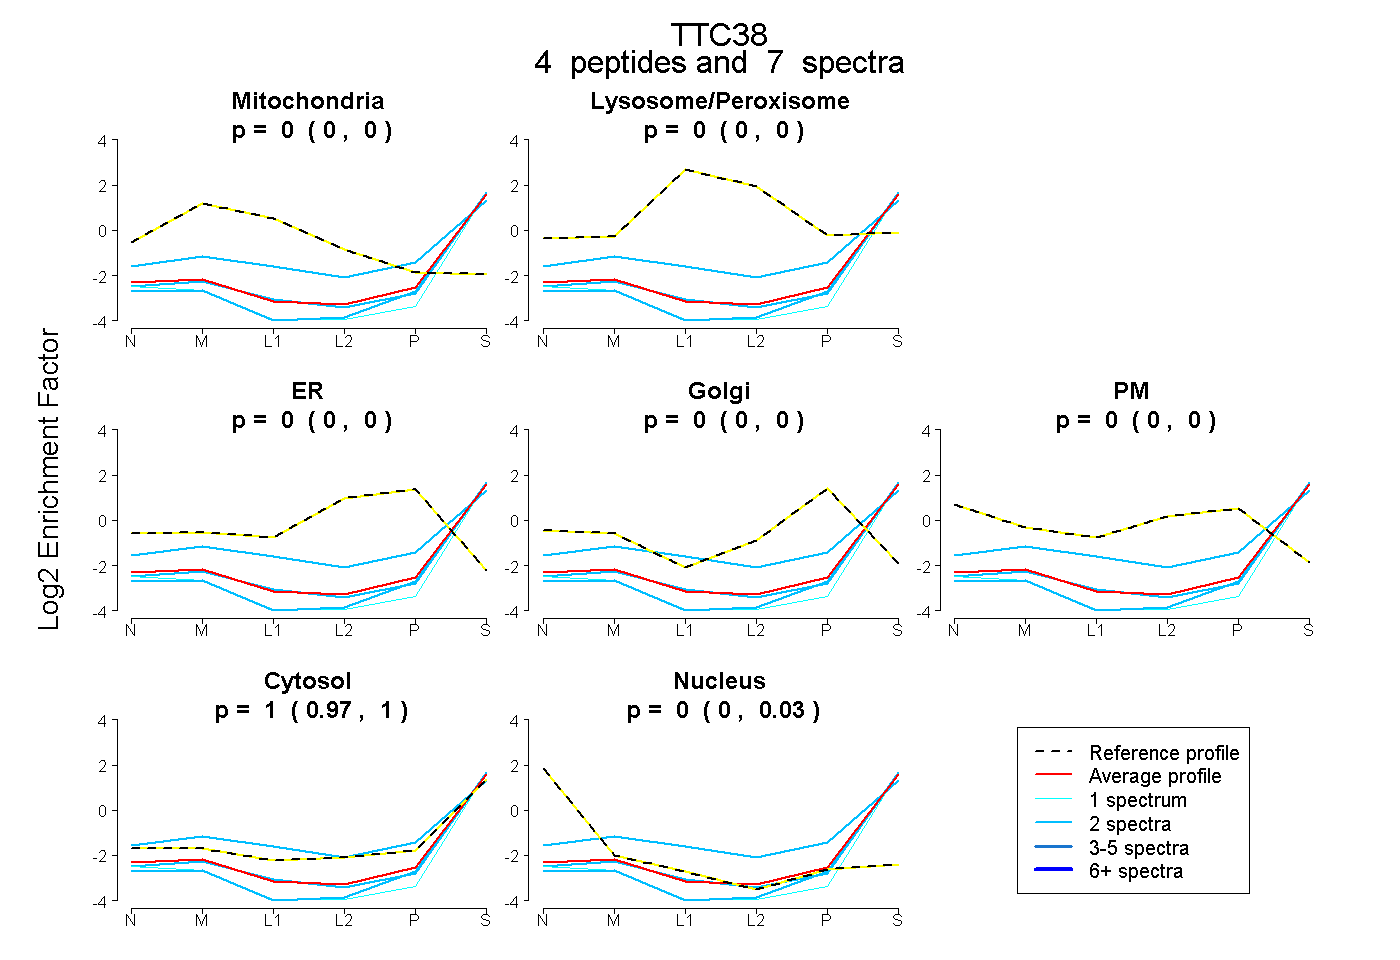 |
0.000 0.000 | 0.000 |
0.000 0.000 | 0.000 |
0.000 0.000 | 0.000 |
0.000 0.000 | 0.000 |
0.000 0.000 | 0.000 |
0.997 0.967 | 1.000 |
0.003 0.000 | 0.029 |
|||
| Plot | Lyso | Other | |||||||||||
| Expt C |
11 peptides |
21 spectra |
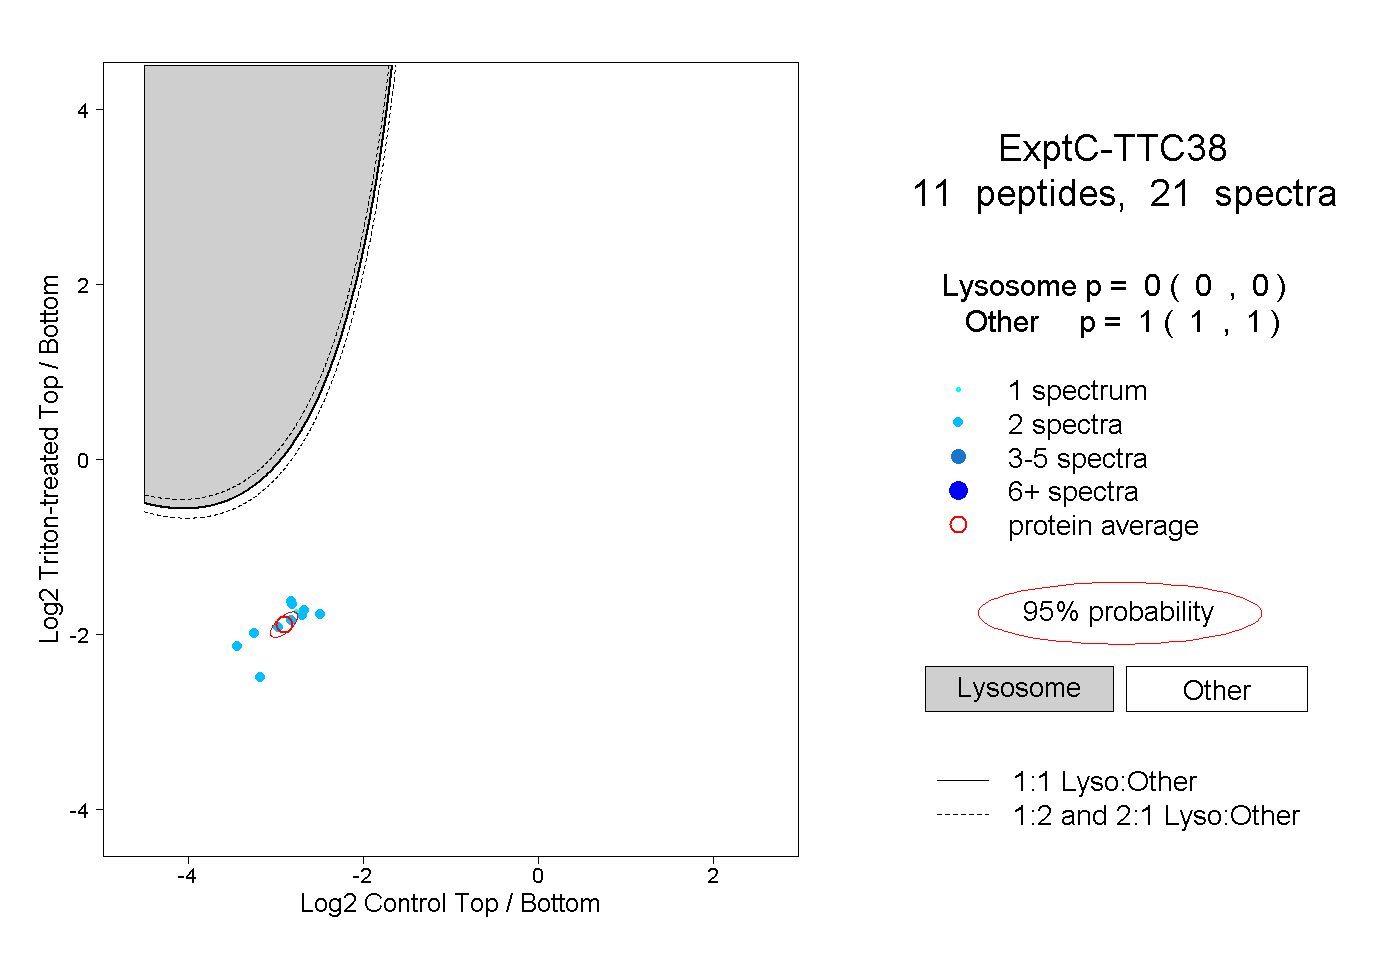 |
0.000 0.000 | 0.000 |
1.000 1.000 | 1.000 |