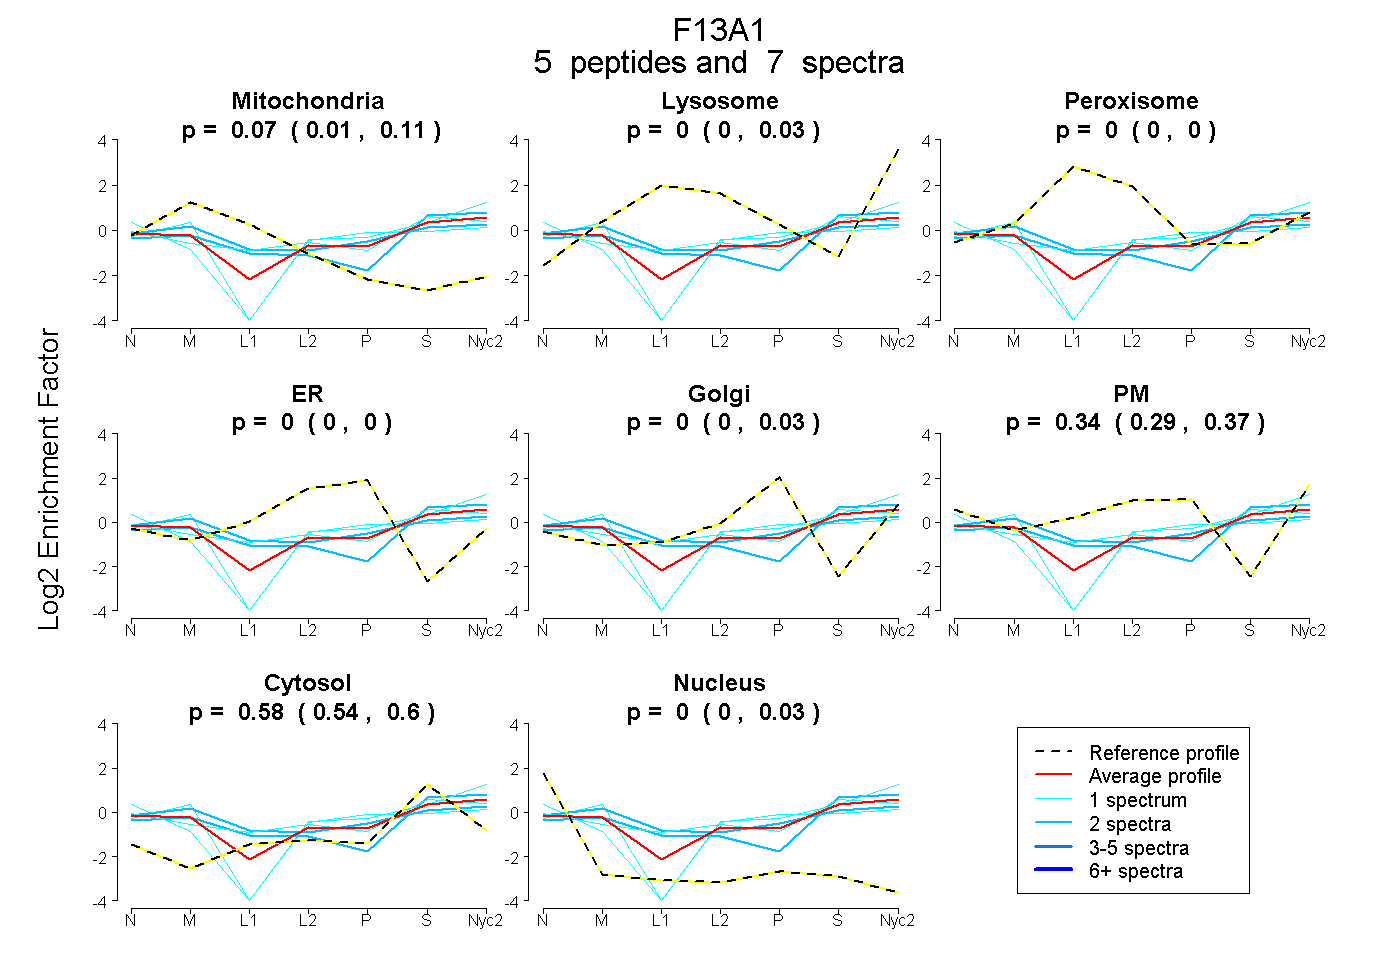
 5
5peptides
spectra
0.012 | 0.106
0.000 | 0.027
0.000 | 0.000
0.000 | 0.000
0.000 | 0.026
0.293 | 0.371
0.543 | 0.603
0.000 | 0.030
| Plot | Mito | Lyso | Perox | ER | Golgi | PM | Cytosol | Nucleus | |||||
| Expt A |
5 peptides |
7 spectra |
|
0.073 0.012 | 0.106 |
0.000 0.000 | 0.027 |
0.000 0.000 | 0.000 |
0.000 0.000 | 0.000 |
0.000 0.000 | 0.026 |
0.343 0.293 | 0.371 |
0.584 0.543 | 0.603 |
0.000 0.000 | 0.030 |
| 2 spectra, VEYVIGR | 0.218 | 0.087 | 0.000 | 0.000 | 0.000 | 0.251 | 0.444 | 0.000 | ||
| 1 spectrum, EIGGDGMQDITDTYK | 0.051 | 0.000 | 0.000 | 0.000 | 0.441 | 0.000 | 0.438 | 0.070 | ||
| 1 spectrum, VIMNEDR | 0.089 | 0.094 | 0.016 | 0.000 | 0.000 | 0.227 | 0.573 | 0.000 | ||
| 2 spectra, NVWLHLEGPGVMRPK | 0.185 | 0.228 | 0.000 | 0.000 | 0.000 | 0.000 | 0.581 | 0.006 | ||
| 1 spectrum, SDVDMNFDVENAVLGK | 0.000 | 0.000 | 0.000 | 0.000 | 0.235 | 0.183 | 0.532 | 0.051 |
| Plot | Lyso | Other | |||||||||||
| Expt C |
2 peptides |
6 spectra |
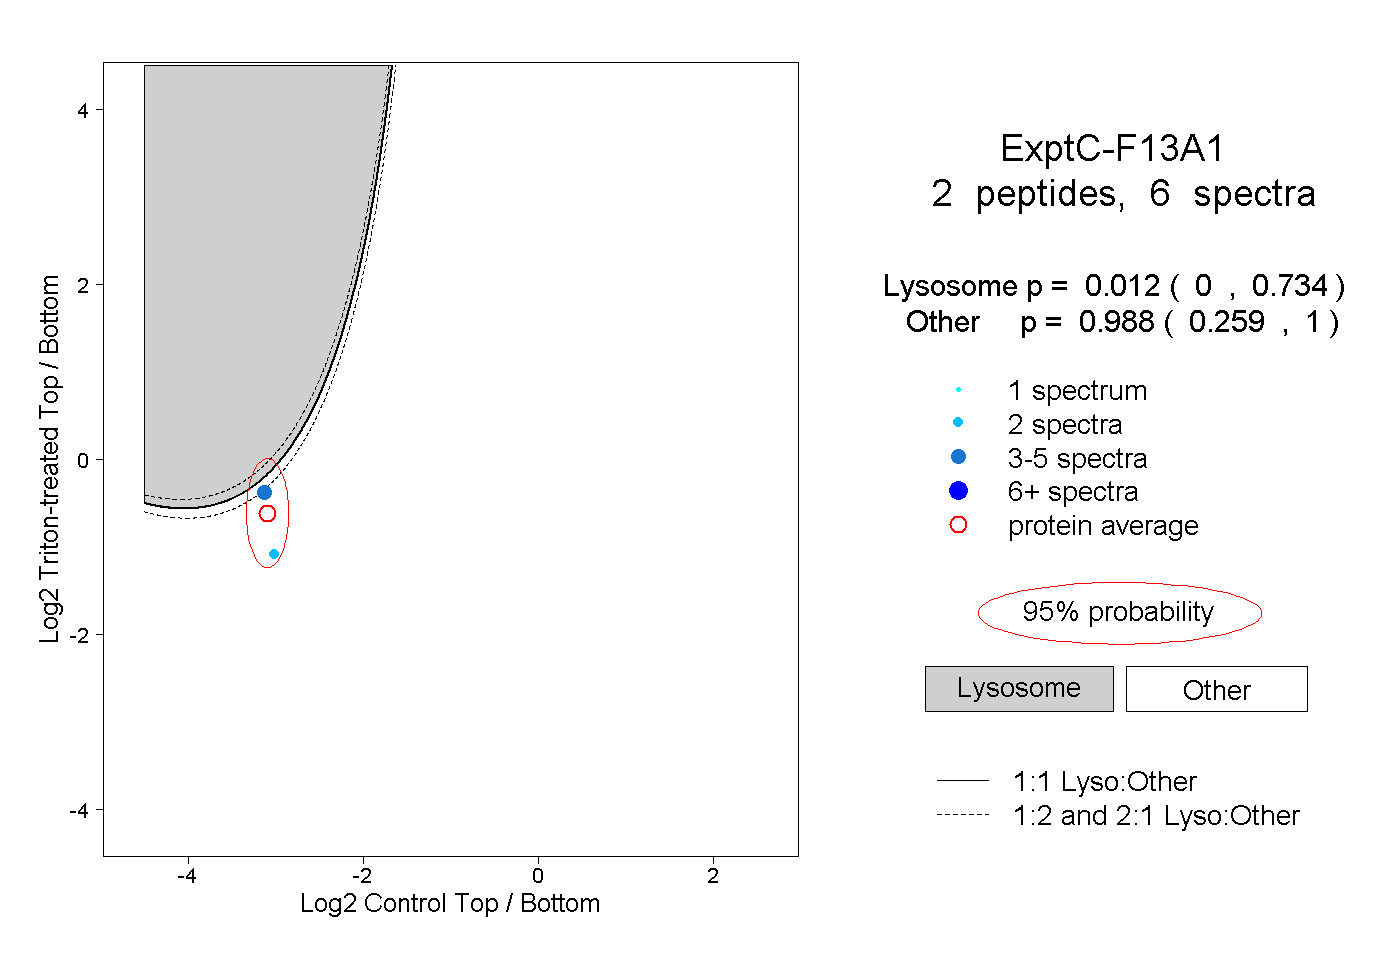 |
0.012 0.000 | 0.734 |
0.988 0.259 | 1.000 |