 2
2peptides
spectra
NA | NA
NA | NA
NA | NA
NA | NA
NA | NA
NA | NA
NA | NA
NA | NA
| Plot | Mito | Lyso | Perox | ER | Golgi | PM | Cytosol | Nucleus | |||||
| Expt A |
2 peptides |
2 spectra |
|
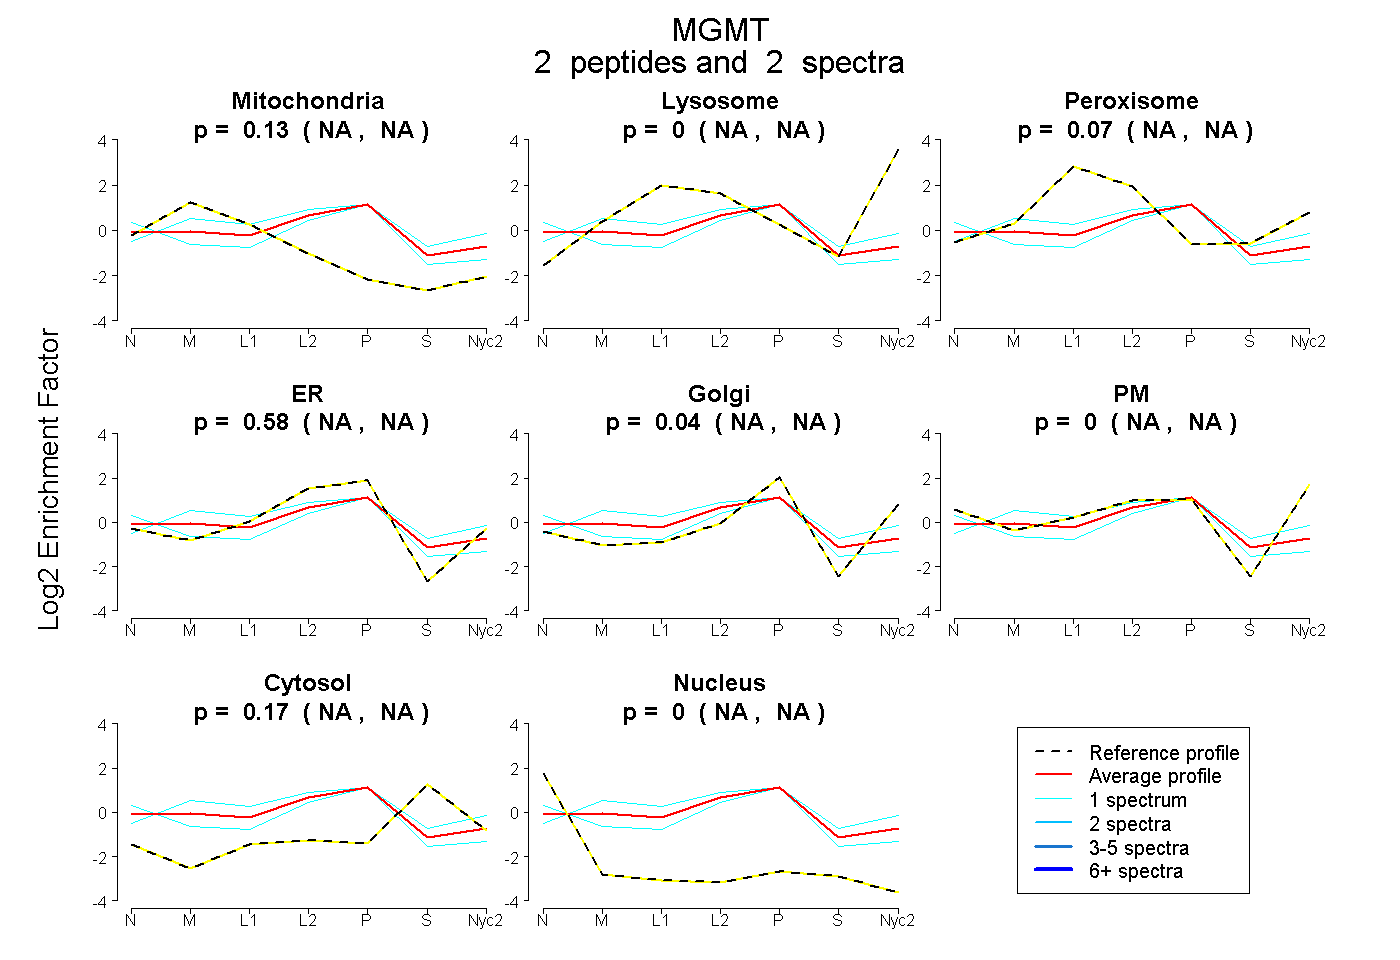
0.127 NA | NA |
0.000 NA | NA |
0.073 NA | NA |
0.584 NA | NA |
0.044 NA | NA |
0.000 NA | NA |
0.172 NA | NA |
0.000 NA | NA |
| 1 spectrum, AVGGAMR | 0.250 | 0.000 | 0.101 | 0.608 | 0.000 | 0.000 | 0.040 | 0.000 | ||
| 1 spectrum, SNPVPILIPCHR | 0.000 | 0.000 | 0.000 | 0.357 | 0.056 | 0.282 | 0.301 | 0.005 |