MGC94335
[ENSRNOP00000021533]
Main page
| | | Plot |
Mito |
Lyso |
|
Perox |
ER |
Golgi |
PM |
Cytosol |
Nucleus |
|
| Expt A |
 4
4
peptides |
8
spectra |
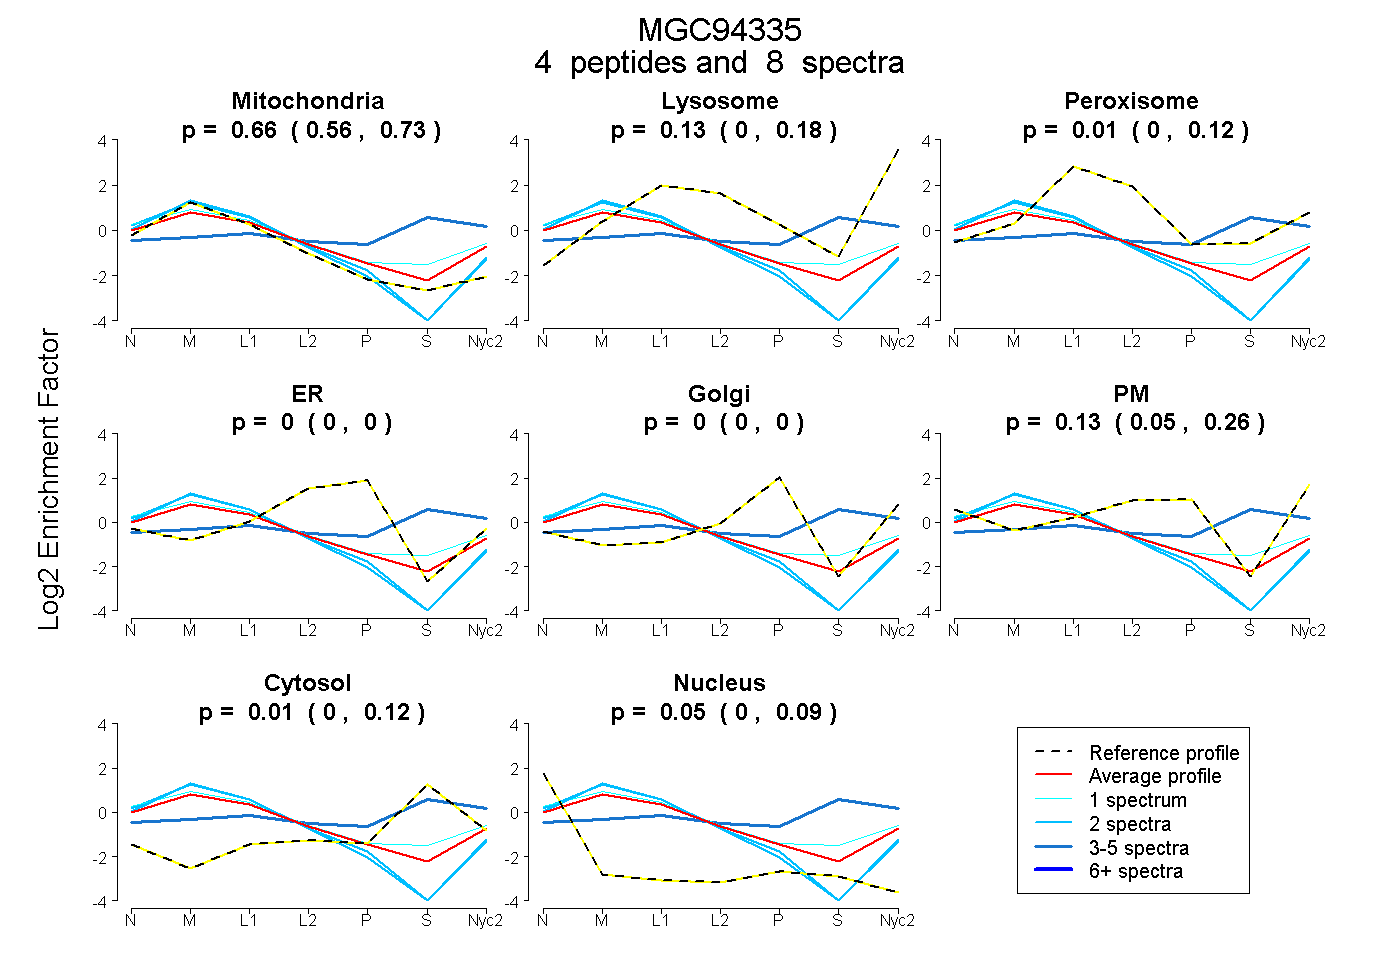 |
0.659
0.563 | 0.727 |
0.133
0.000 | 0.182 |
|
0.015
0.000 | 0.118 |
0.000
0.000 | 0.000 |
0.000
0.000 | 0.000 |
0.133
0.045 | 0.259 |
0.007
0.000 | 0.117 |
0.053
0.000 | 0.094 |
|
| | | Plot |
Mito |
|
Lyso or Perox |
|
ER |
Golgi |
PM |
Cytosol |
Nucleus |
|
| Expt B |
3
peptides |
6
spectra |
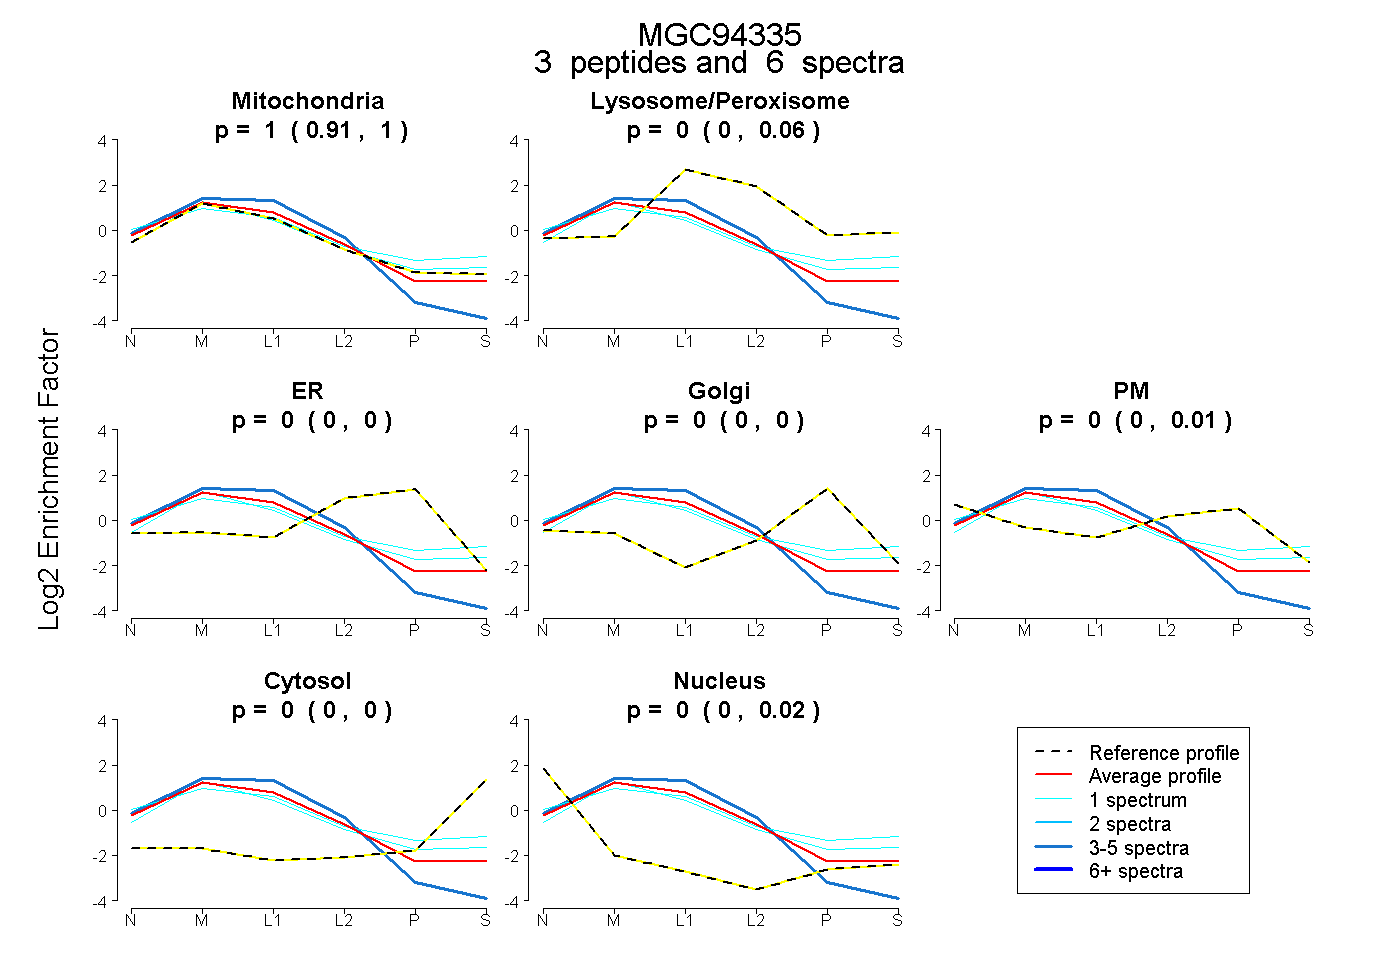 |
1.000
0.914 | 1.000 |
|
0.000
0.000 | 0.060 |
|
0.000
0.000 | 0.000 |
0.000
0.000 | 0.000 |
0.000
0.000 | 0.013 |
0.000
0.000 | 0.000 |
0.000
0.000 | 0.019 |
|
| 1 spectrum, QLLSASYEFQR |
0.945 |
|
0.014 |
|
0.000 |
0.008 |
0.000 |
0.033 |
0.000 |
|
| 1 spectrum, QAFAYVSK |
0.702 |
|
0.147 |
|
0.000 |
0.000 |
0.074 |
0.042 |
0.035 |
|
| 4 spectra, FDLLEELVAK |
1.000 |
|
0.000 |
|
0.000 |
0.000 |
0.000 |
0.000 |
0.000 |
|
| | | Plot |
|
Lyso |
|
|
|
|
|
|
|
Other |
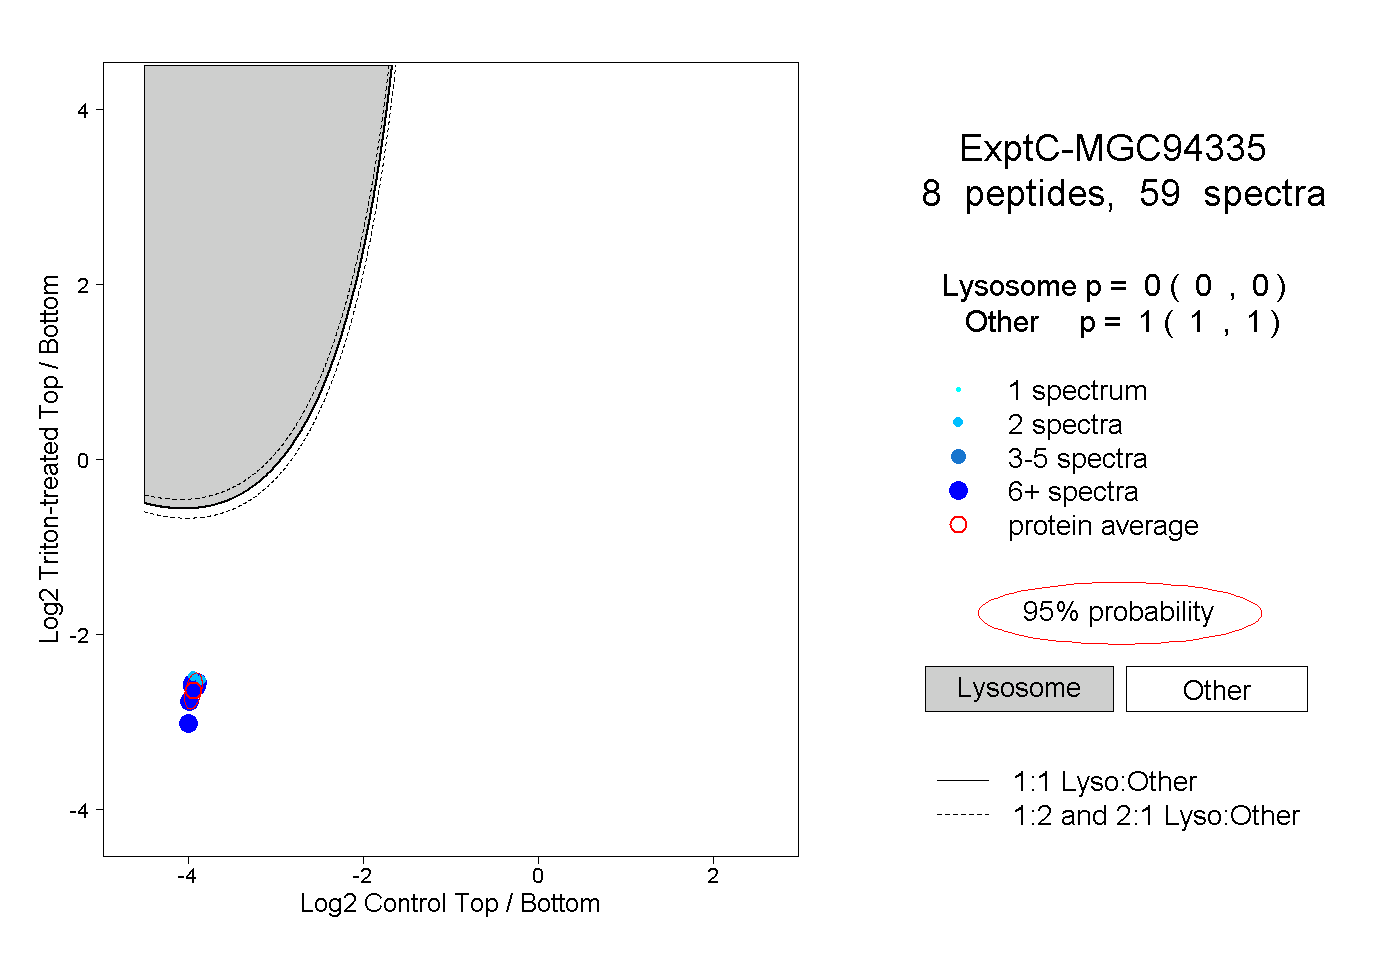
| Expt C |
8
peptides |
59
spectra |
 |
|
0.000
0.000 | 0.000 |
|
|
|
|
|
|
|
1.000
1.000 | 1.000 |
| | | Plot |
|
Lyso |
|
|
|
|
|
|
|
Other |
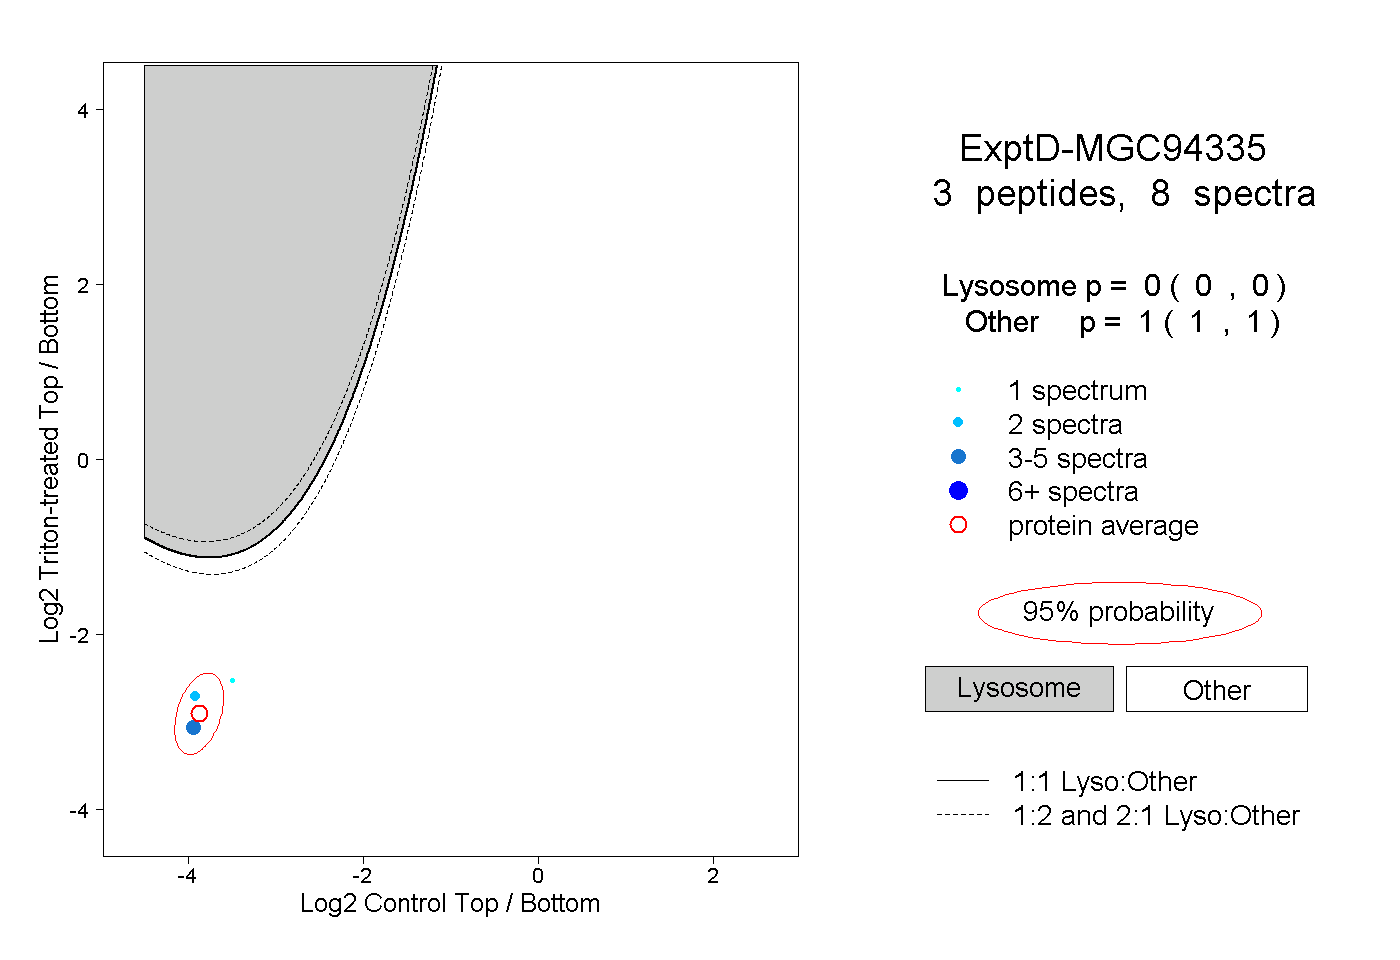
| Expt D |
3
peptides |
8
spectra |
 |
|
0.000
0.000 | 0.000 |
|
|
|
|
|
|
|
1.000
1.000 | 1.000 |