8
8peptides
spectra
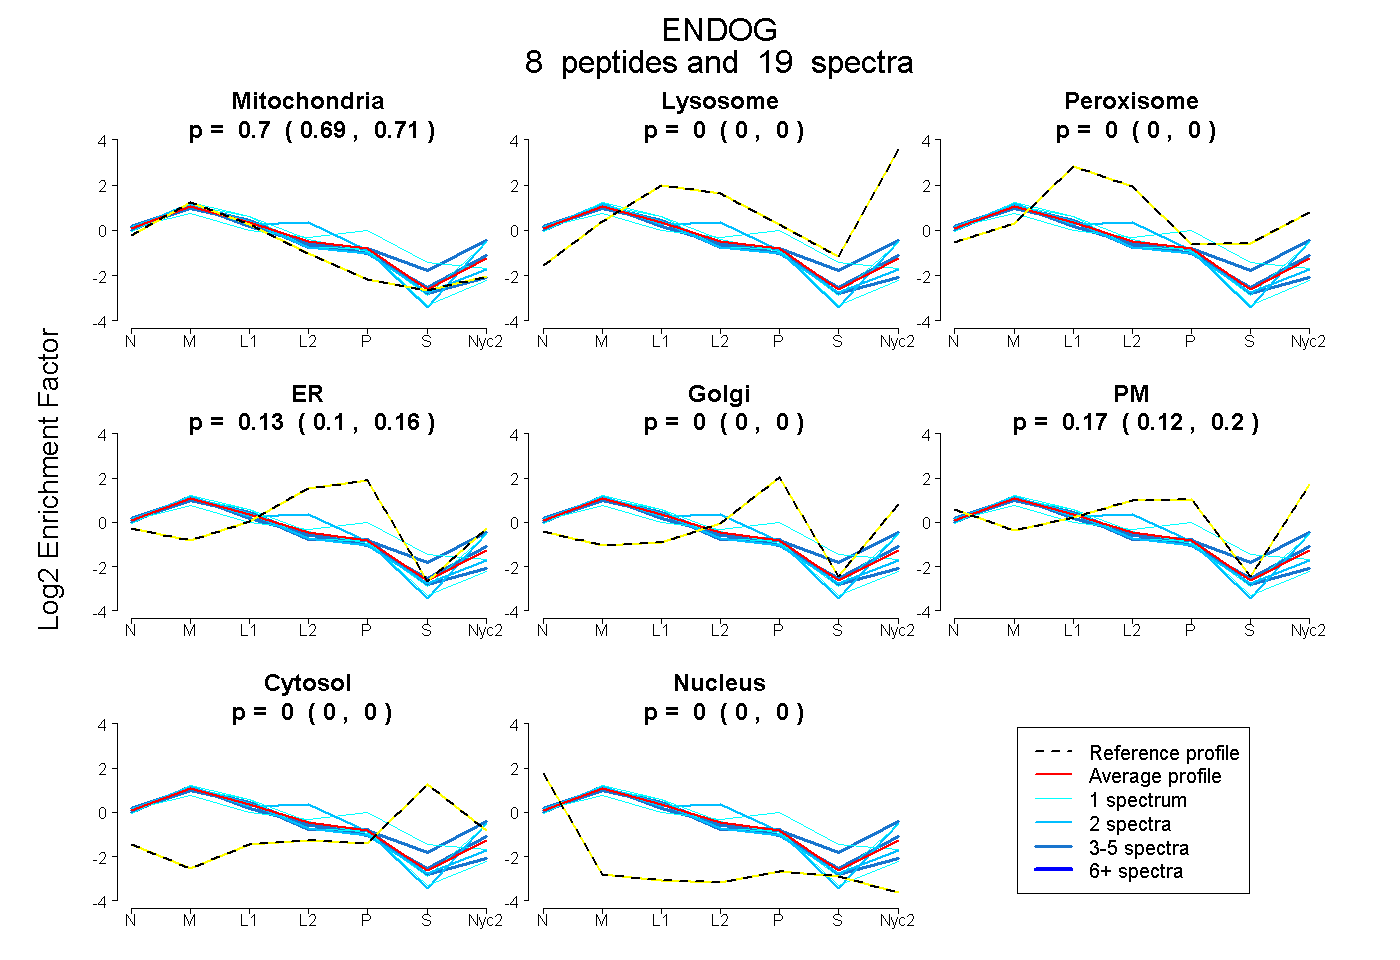
0.690 | 0.714
0.000 | 0.000
0.000 | 0.001
0.096 | 0.164
0.000 | 0.000
0.119 | 0.202
0.000 | 0.000
0.000 | 0.000
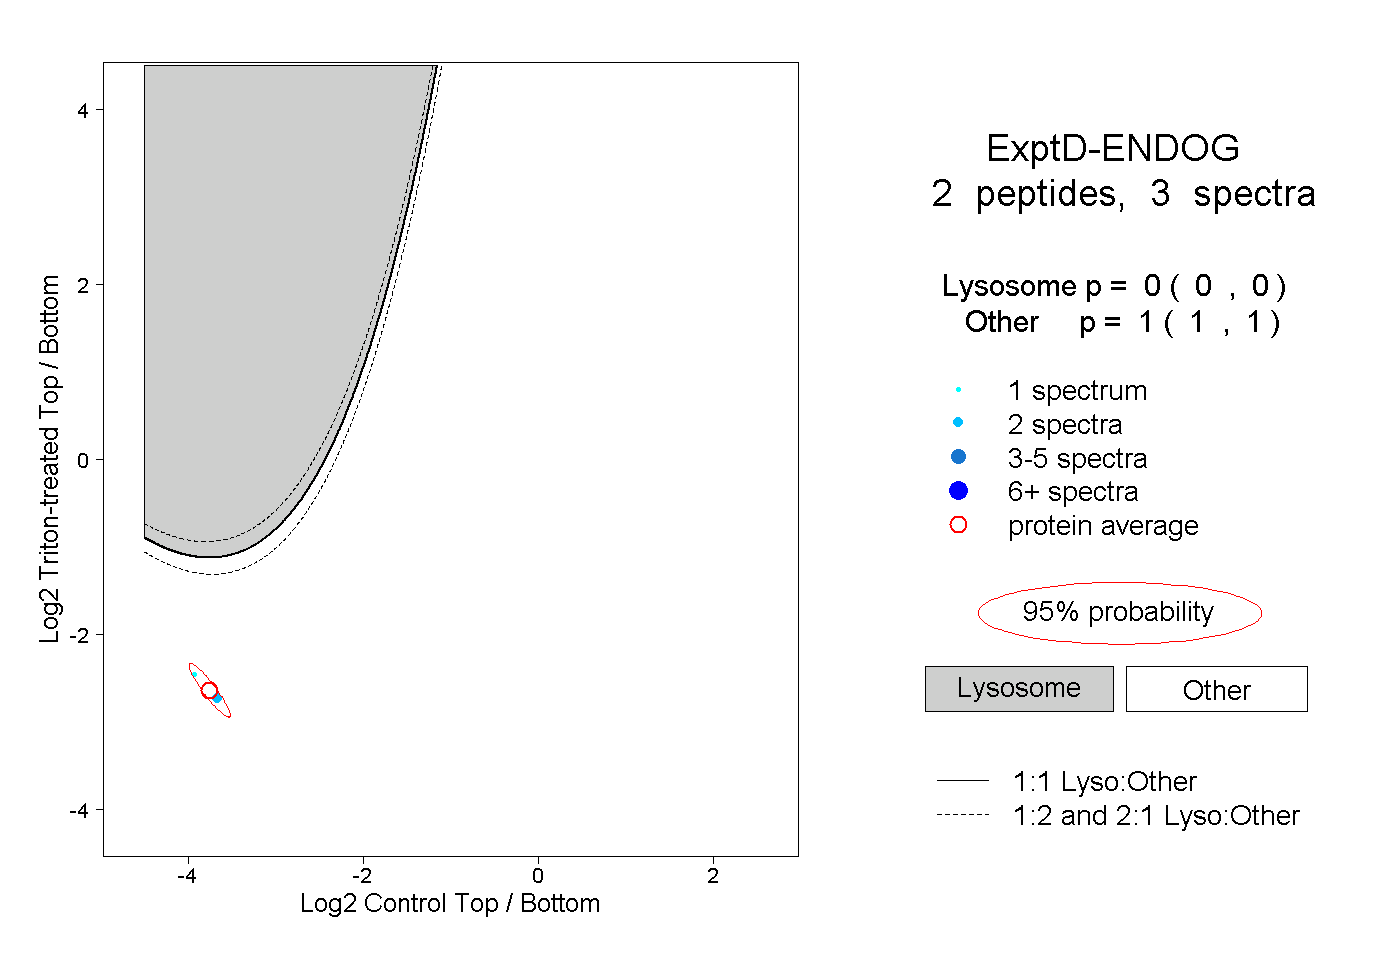
2peptides
spectra
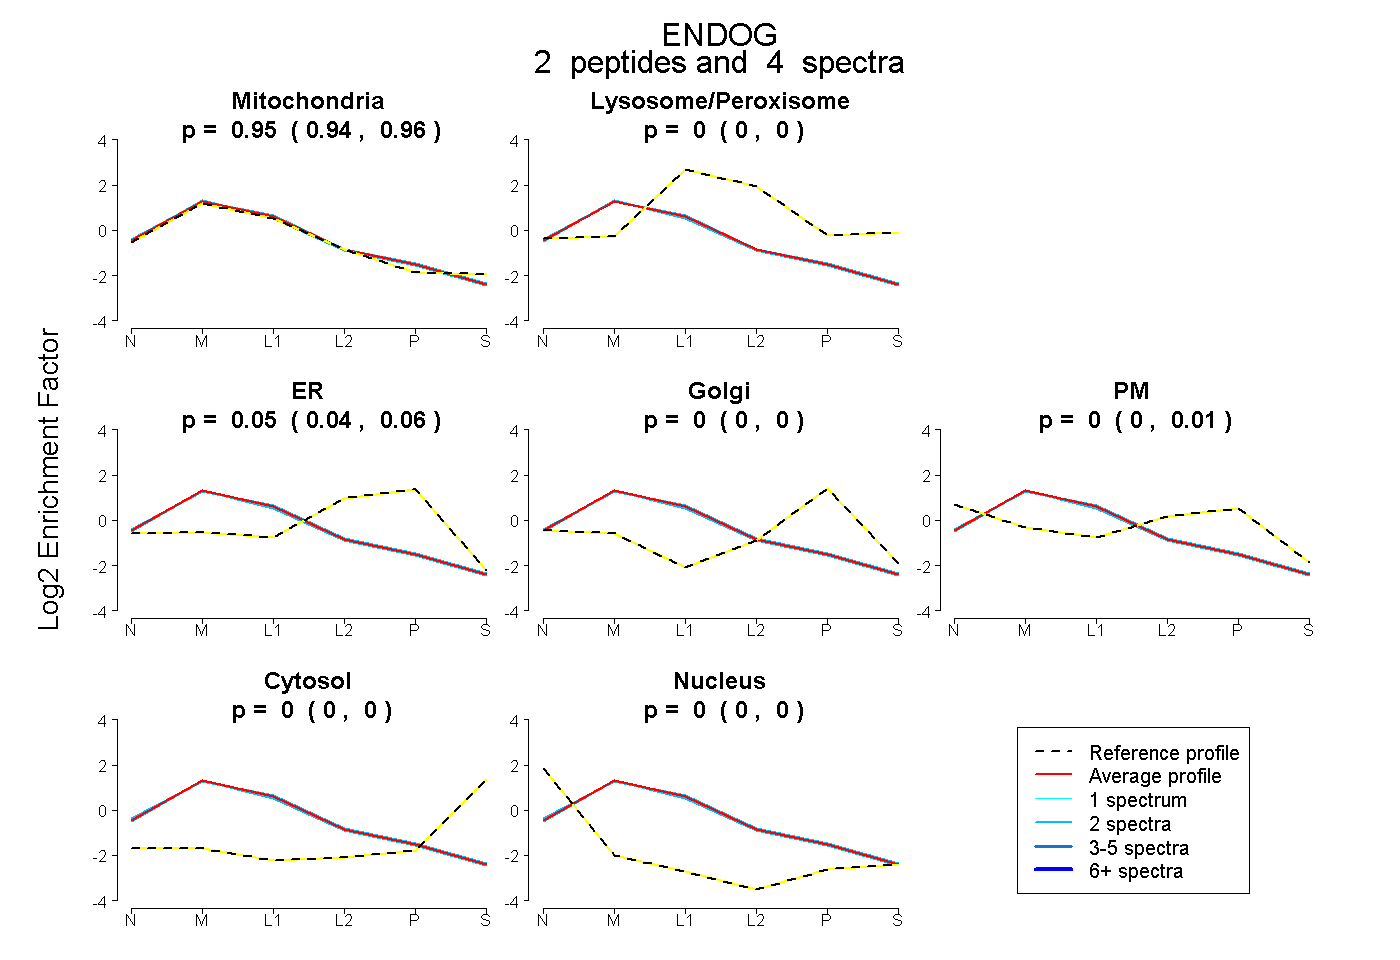
0.941 | 0.956
0.000 | 0.000
0.040 | 0.057
0.000 | 0.001
0.000 | 0.005
0.000 | 0.000
0.000 | 0.000
13peptides
spectra
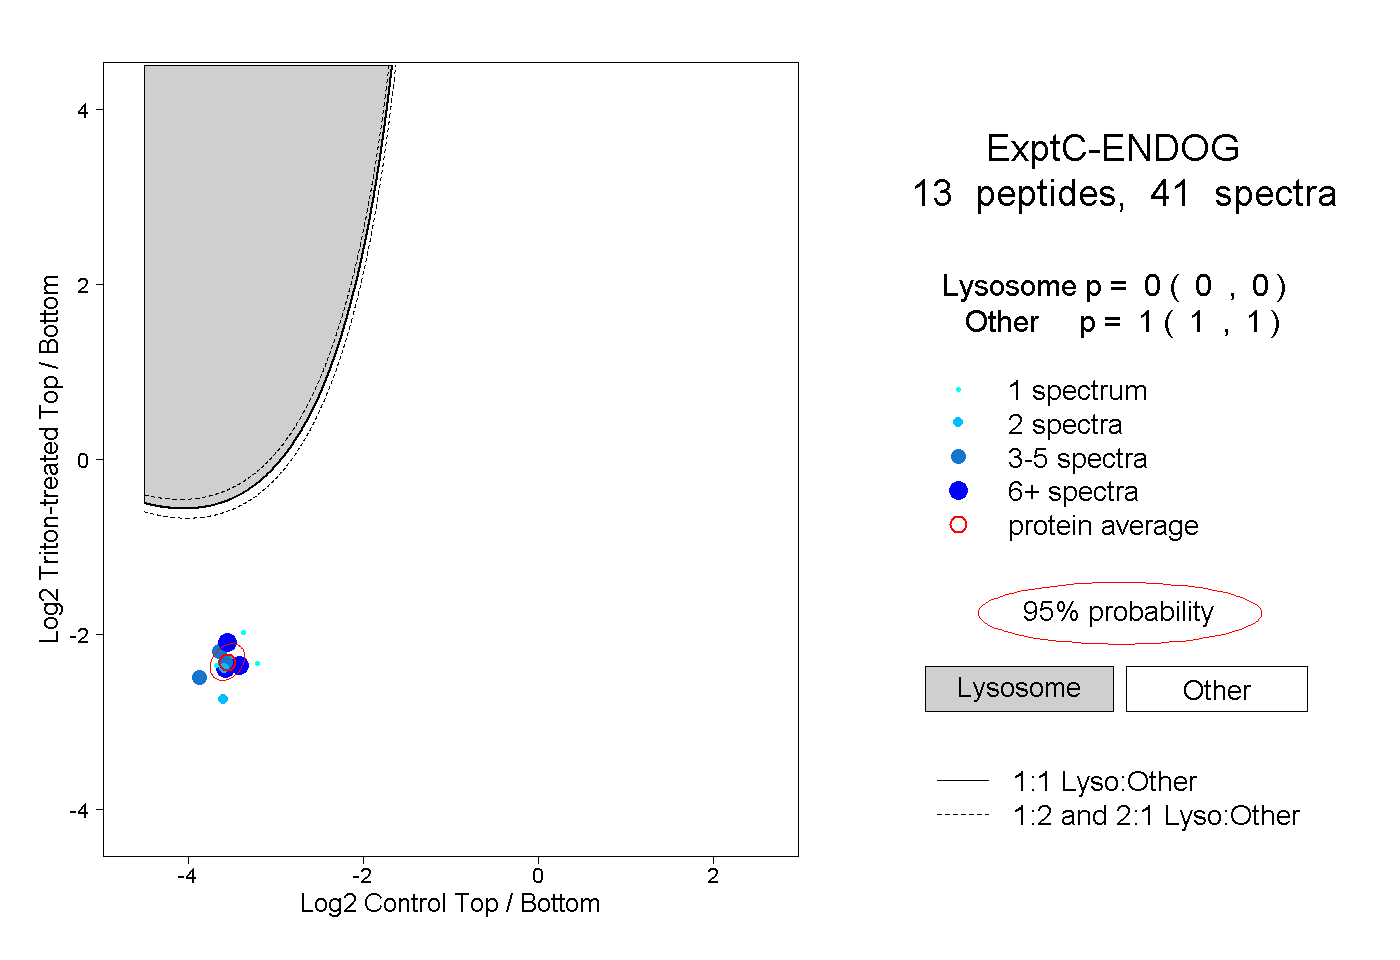
0.000 | 0.000
1.000 | 1.000