 8
8peptides
spectra
0.690 | 0.714
0.000 | 0.000
0.000 | 0.001
0.096 | 0.164
0.000 | 0.000
0.119 | 0.202
0.000 | 0.000
0.000 | 0.000
| Plot | Mito | Lyso | Perox | ER | Golgi | PM | Cytosol | Nucleus | |||||
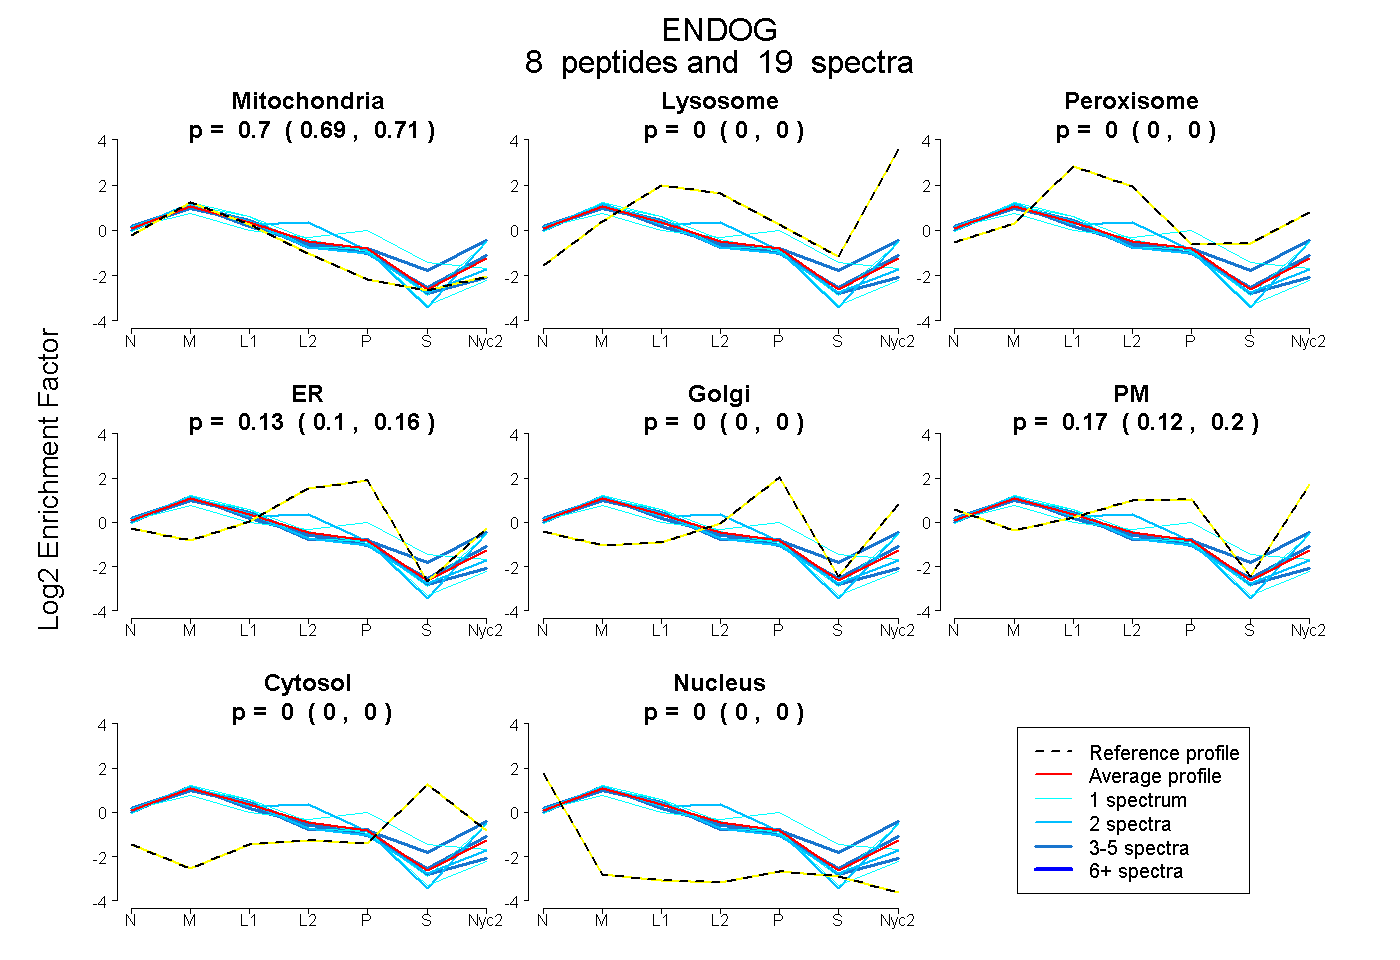
| Expt A |
8 peptides |
19 spectra |
|
0.702 0.690 | 0.714 |
0.000 0.000 | 0.000 |
0.000 0.000 | 0.001 |
0.131 0.096 | 0.164 |
0.000 0.000 | 0.000 |
0.166 0.119 | 0.202 |
0.000 0.000 | 0.000 |
0.000 0.000 | 0.000 |
| 1 spectrum, VLILEAASGQIELR | 0.646 | 0.028 | 0.000 | 0.000 | 0.000 | 0.326 | 0.000 | 0.000 | ||
| 3 spectra, FLVPIESIER | 0.729 | 0.000 | 0.000 | 0.003 | 0.044 | 0.224 | 0.000 | 0.000 | ||
| 2 spectra, NHVAVPTHFFK | 0.587 | 0.000 | 0.000 | 0.039 | 0.000 | 0.374 | 0.000 | 0.000 | ||
| 2 spectra, YGLPGVAQLR | 0.796 | 0.000 | 0.000 | 0.164 | 0.000 | 0.040 | 0.000 | 0.000 | ||
| 1 spectrum, SYVMPNAPVDETLPLER | 0.803 | 0.000 | 0.000 | 0.197 | 0.000 | 0.000 | 0.000 | 0.000 | ||
| 4 spectra, ATNADYR | 0.600 | 0.089 | 0.000 | 0.000 | 0.000 | 0.252 | 0.058 | 0.000 | ||
| 1 spectrum, GHLAAAANHR | 0.529 | 0.000 | 0.006 | 0.353 | 0.000 | 0.000 | 0.111 | 0.000 | ||
| 5 spectra, GALWVLEQLRPER | 0.771 | 0.000 | 0.000 | 0.229 | 0.000 | 0.000 | 0.000 | 0.000 |
| Plot | Mito | Lyso or Perox | ER | Golgi | PM | Cytosol | Nucleus | ||||||
| Expt B |
2 peptides |
4 spectra |
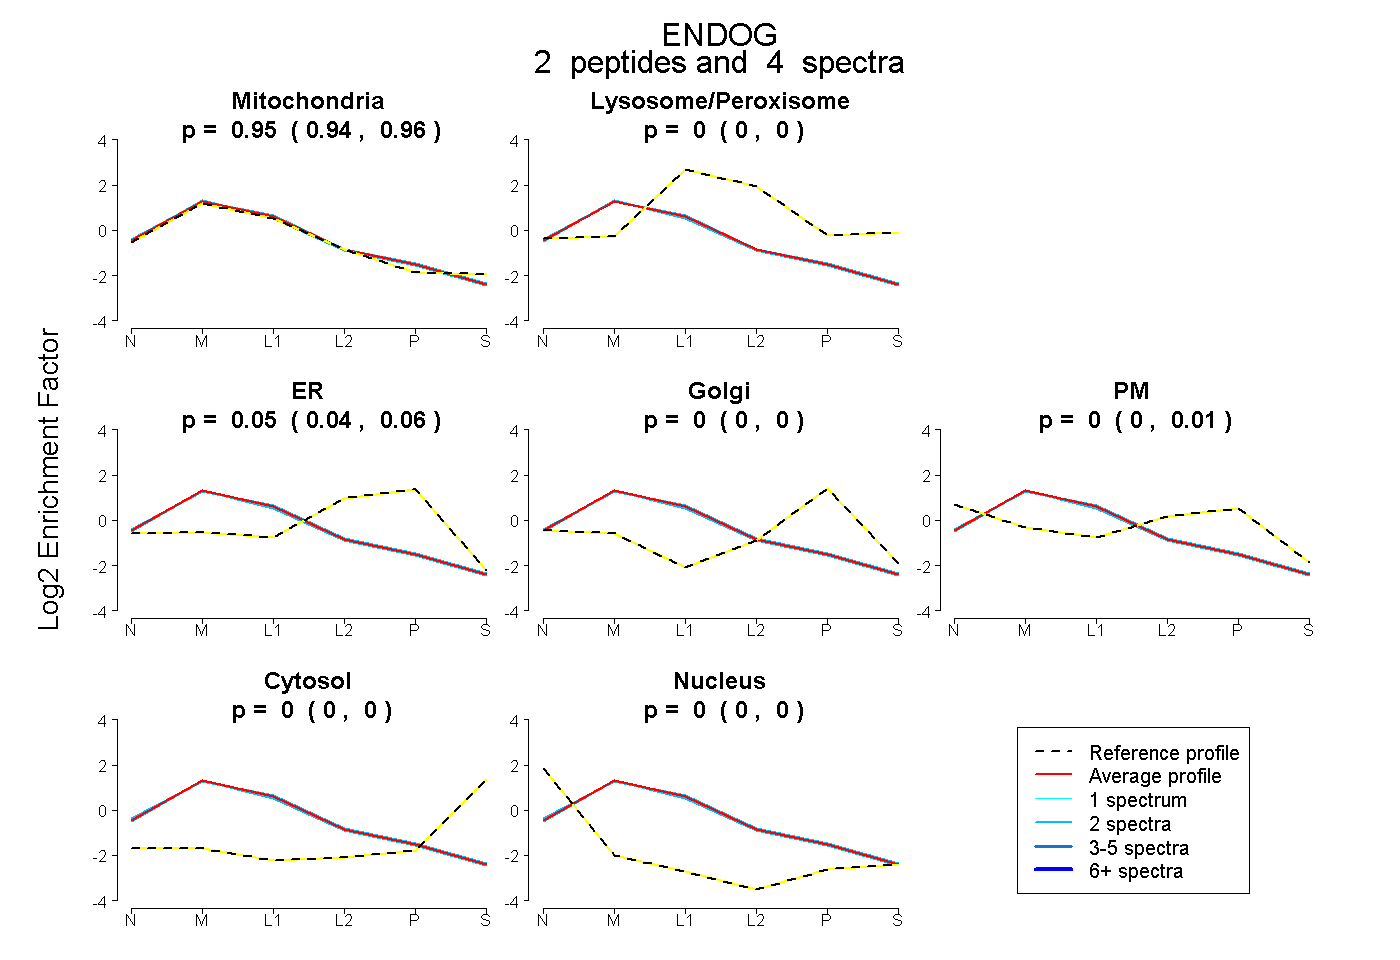 |
0.950 0.941 | 0.956 |
0.000 0.000 | 0.000 |
0.050 0.040 | 0.057 |
0.000 0.000 | 0.001 |
0.000 0.000 | 0.005 |
0.000 0.000 | 0.000 |
0.000 0.000 | 0.000 |
|||
| Plot | Lyso | Other | |||||||||||
| Expt C |
13 peptides |
41 spectra |
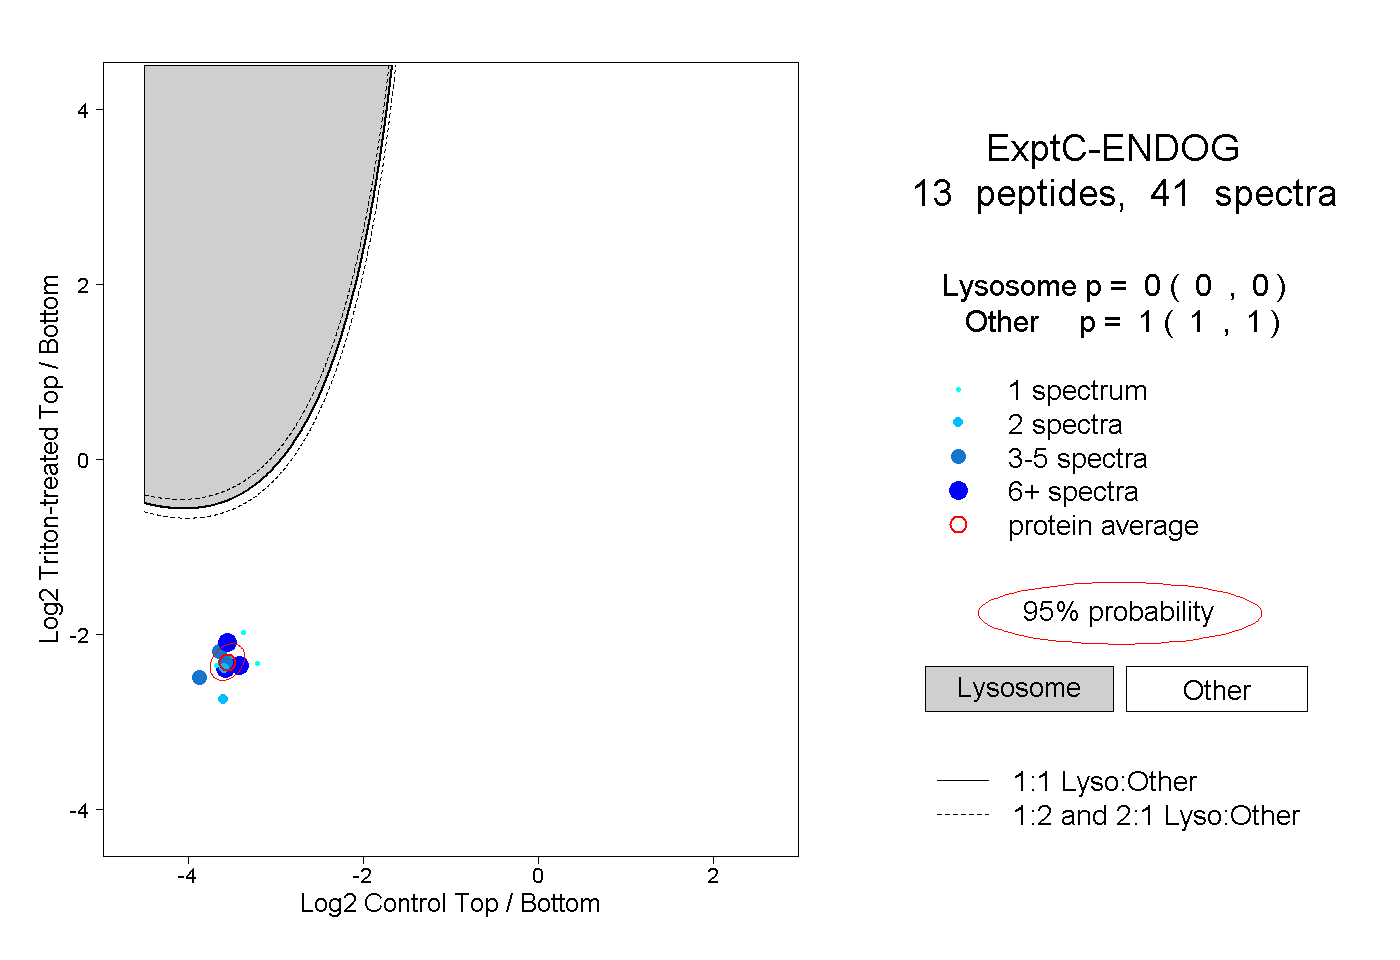 |
0.000 0.000 | 0.000 |
1.000 1.000 | 1.000 |
||||||||
| Plot | Lyso | Other | |||||||||||
| Expt D |
2 peptides |
3 spectra |
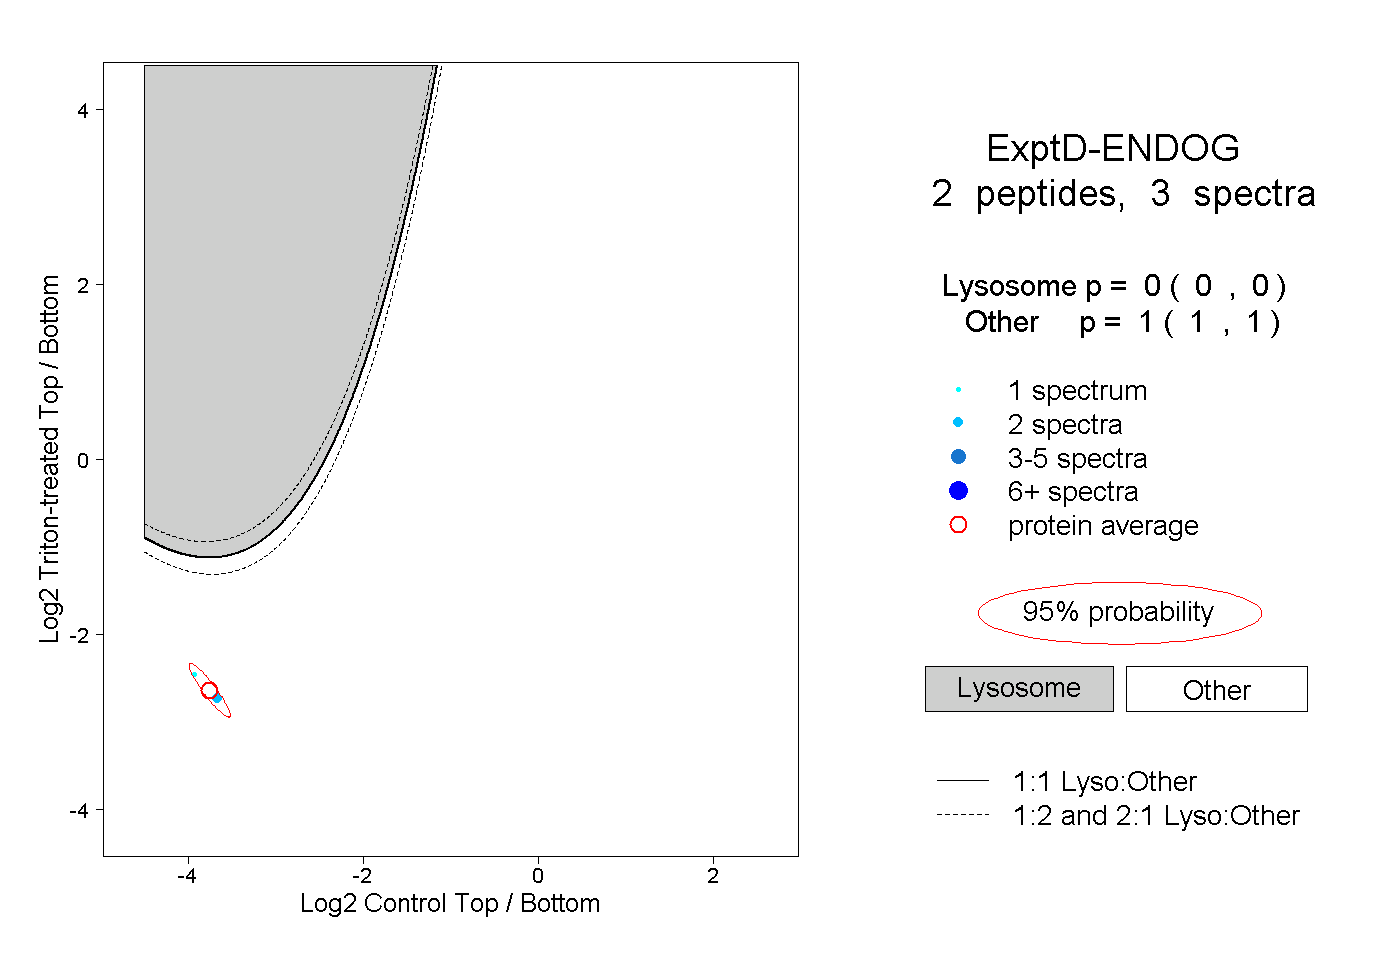 |
0.000 0.000 | 0.000 |
1.000 1.000 | 1.000 |