 19
19peptides
spectra
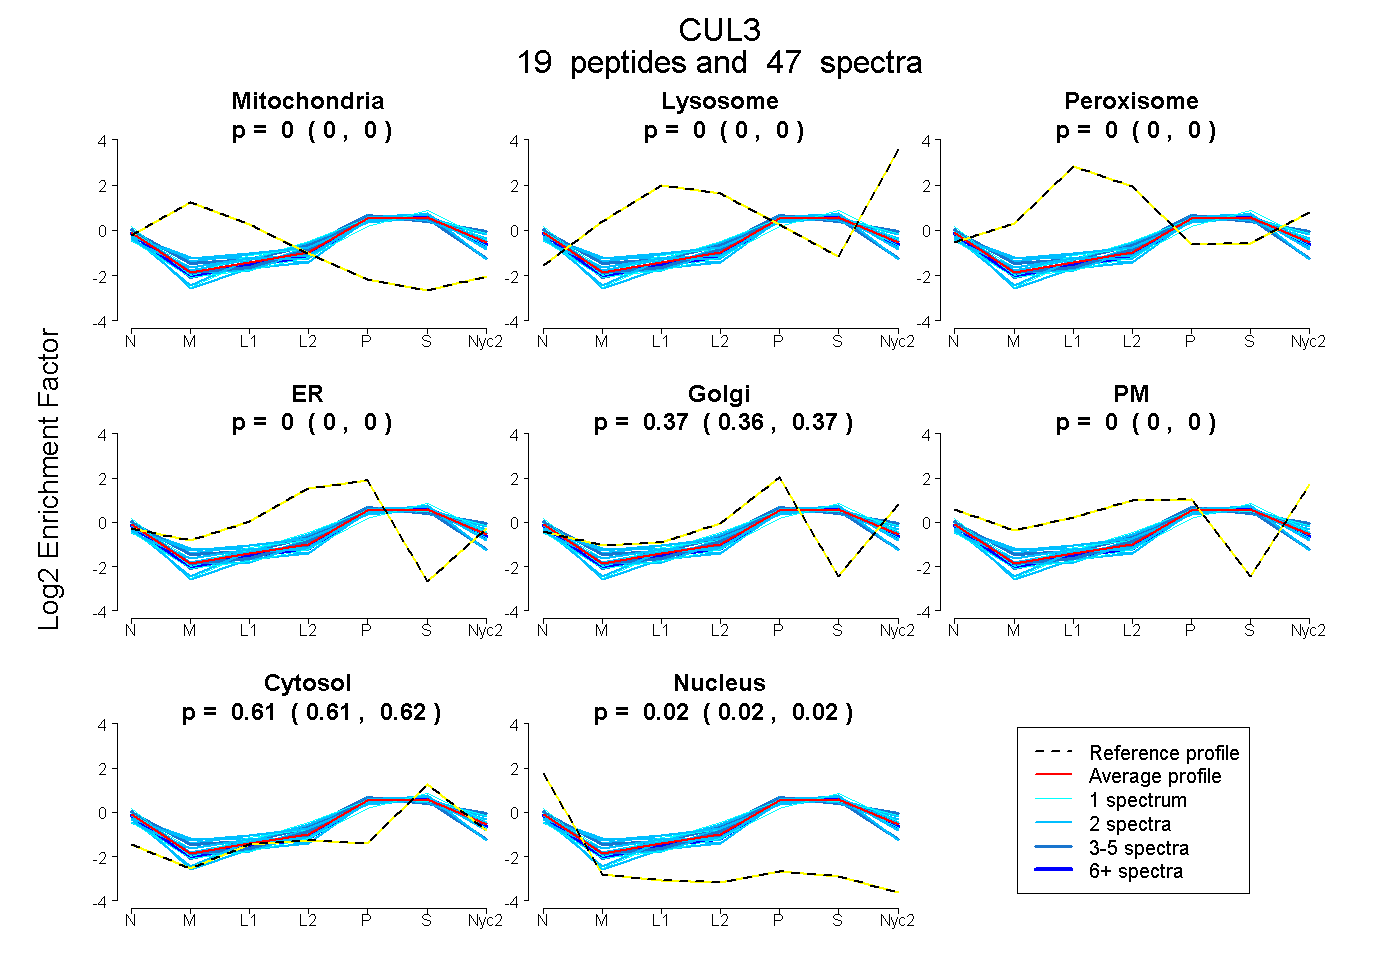
0.000 | 0.000
0.000 | 0.000
0.000 | 0.000
0.000 | 0.000
0.365 | 0.369
0.000 | 0.000
0.612 | 0.616
0.017 | 0.021
4peptides
spectra
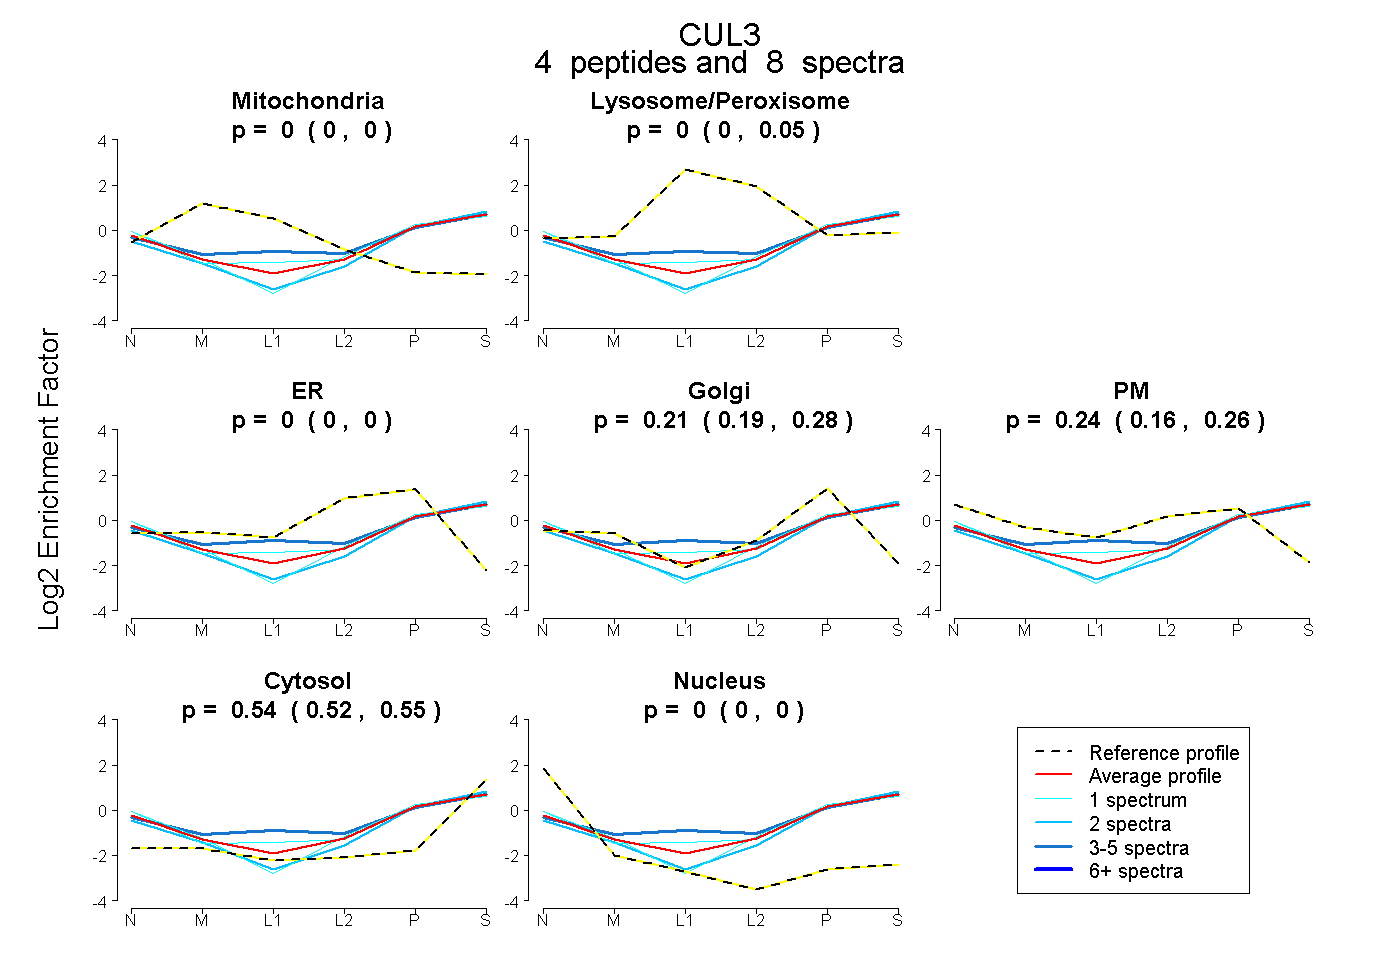
0.000 | 0.000
0.000 | 0.053
0.000 | 0.000
0.185 | 0.278
0.160 | 0.263
0.520 | 0.546
0.000 | 0.000
10peptides
spectra
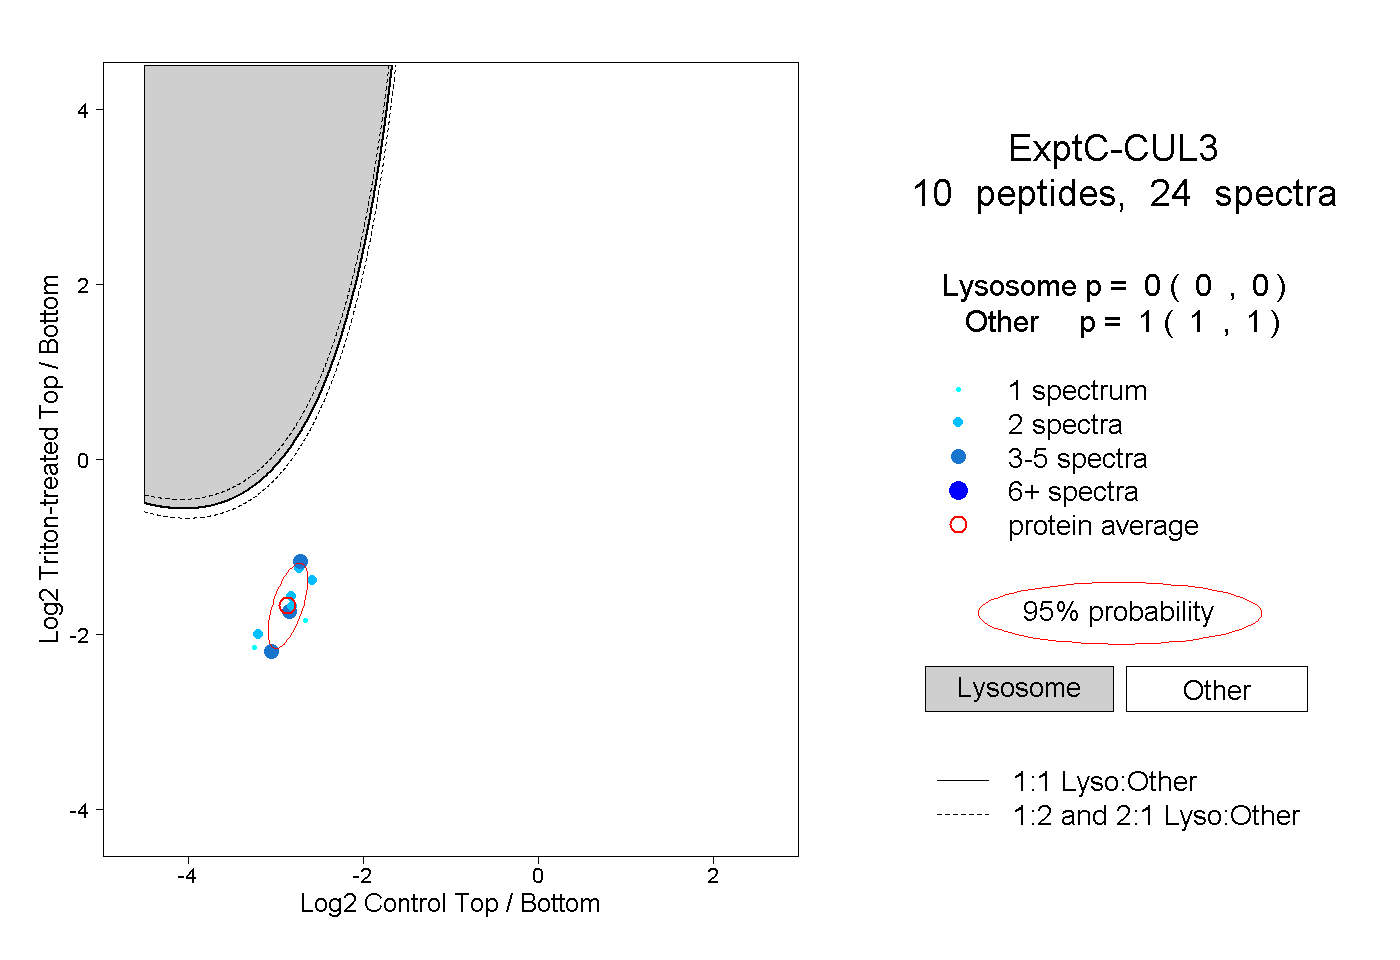
0.000 | 0.000
1.000 | 1.000
2peptides
spectra
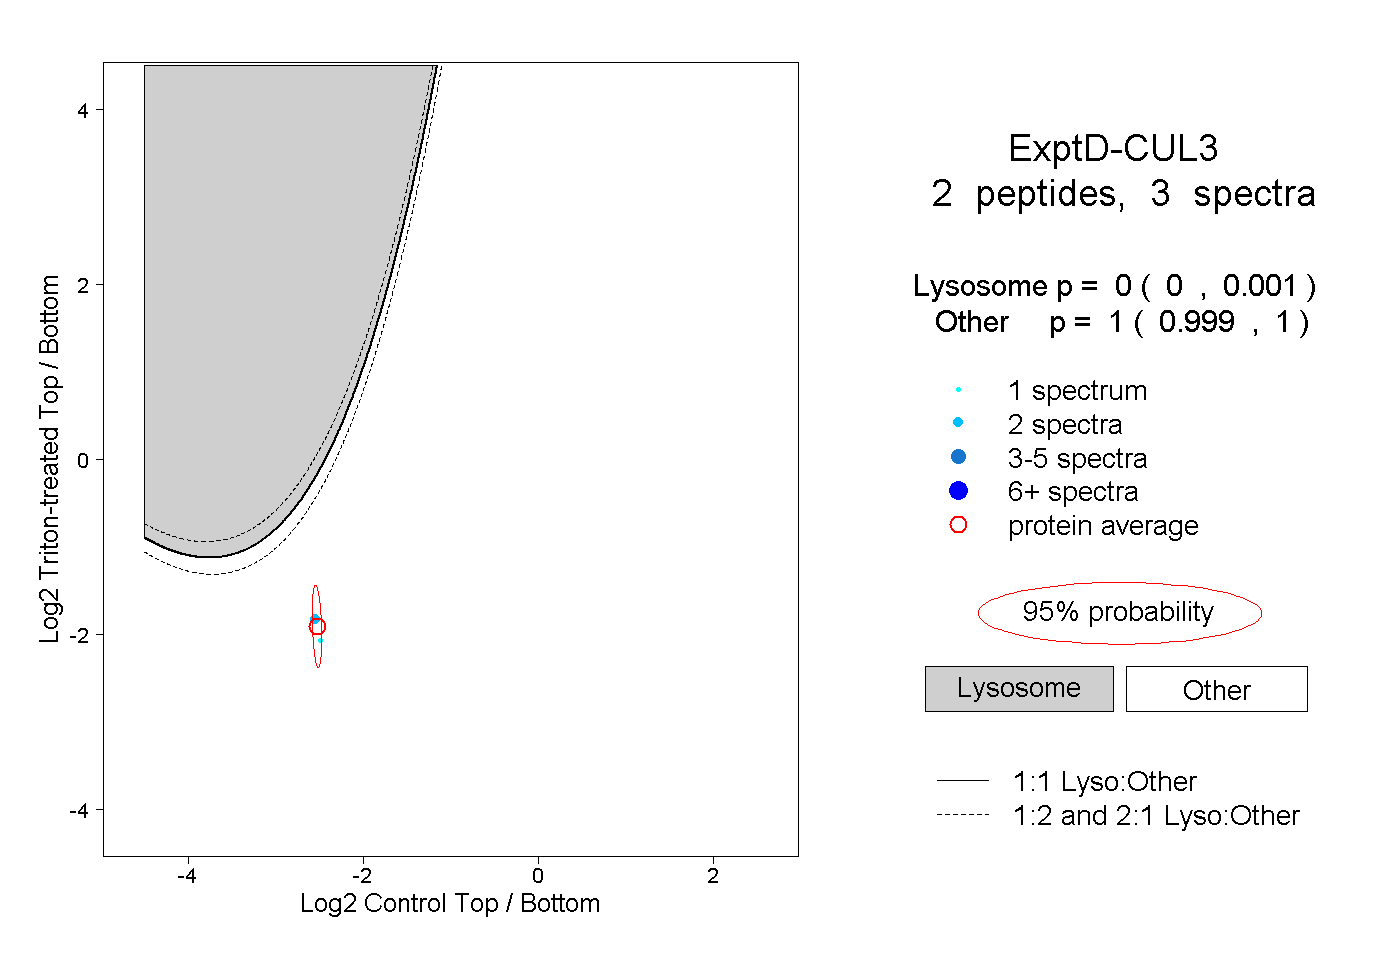
0.000 | 0.001
0.999 | 1.000