7
7peptides
spectra
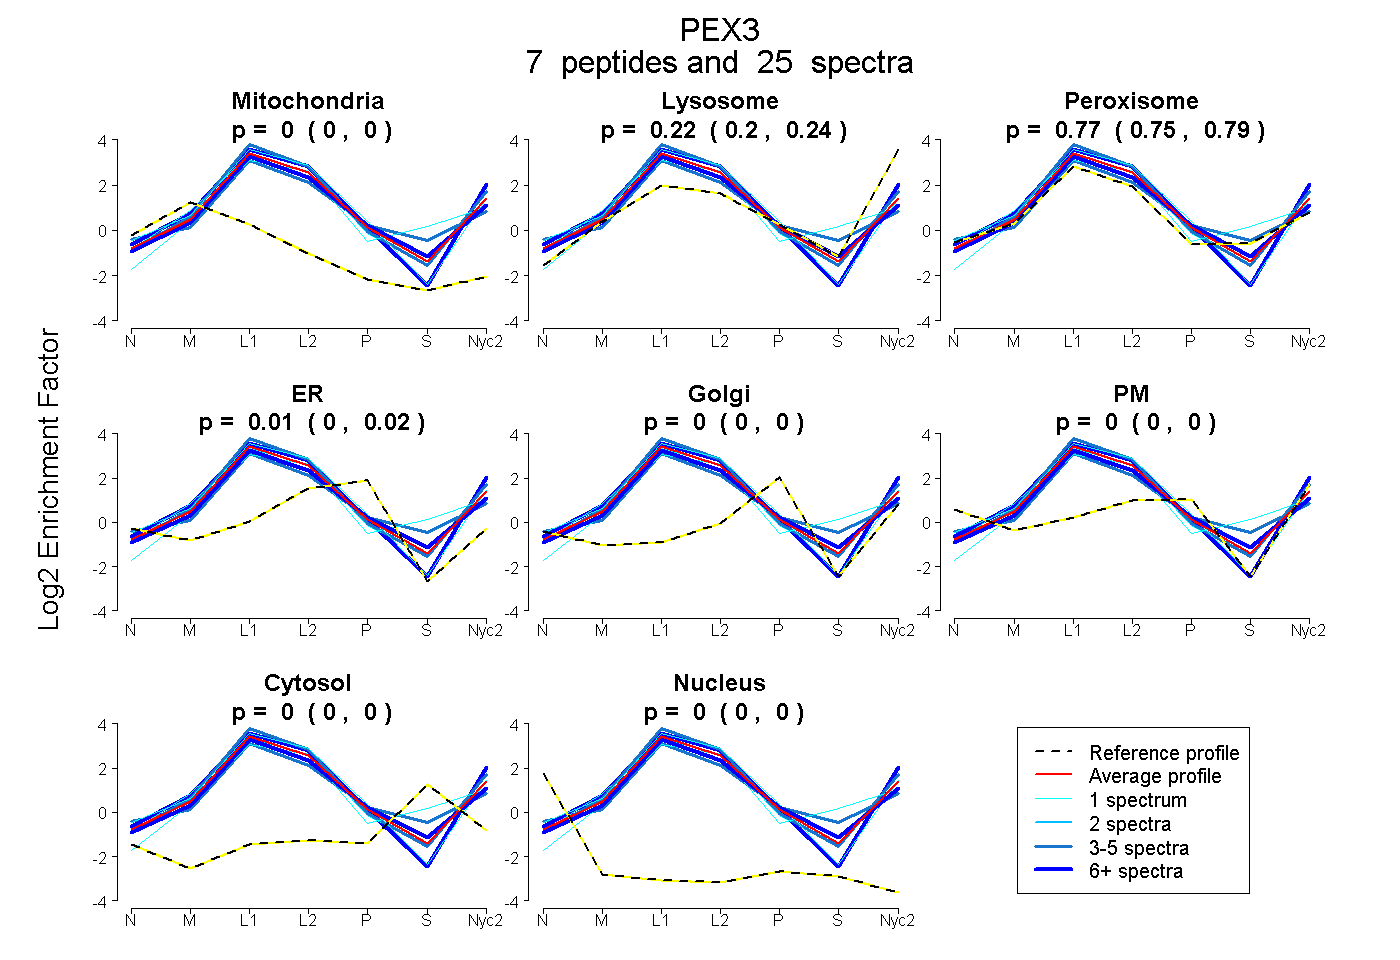
0.000 | 0.000
0.201 | 0.240
0.746 | 0.789
0.000 | 0.020
0.000 | 0.000
0.000 | 0.000
0.000 | 0.000
0.000 | 0.000
8peptides
spectra
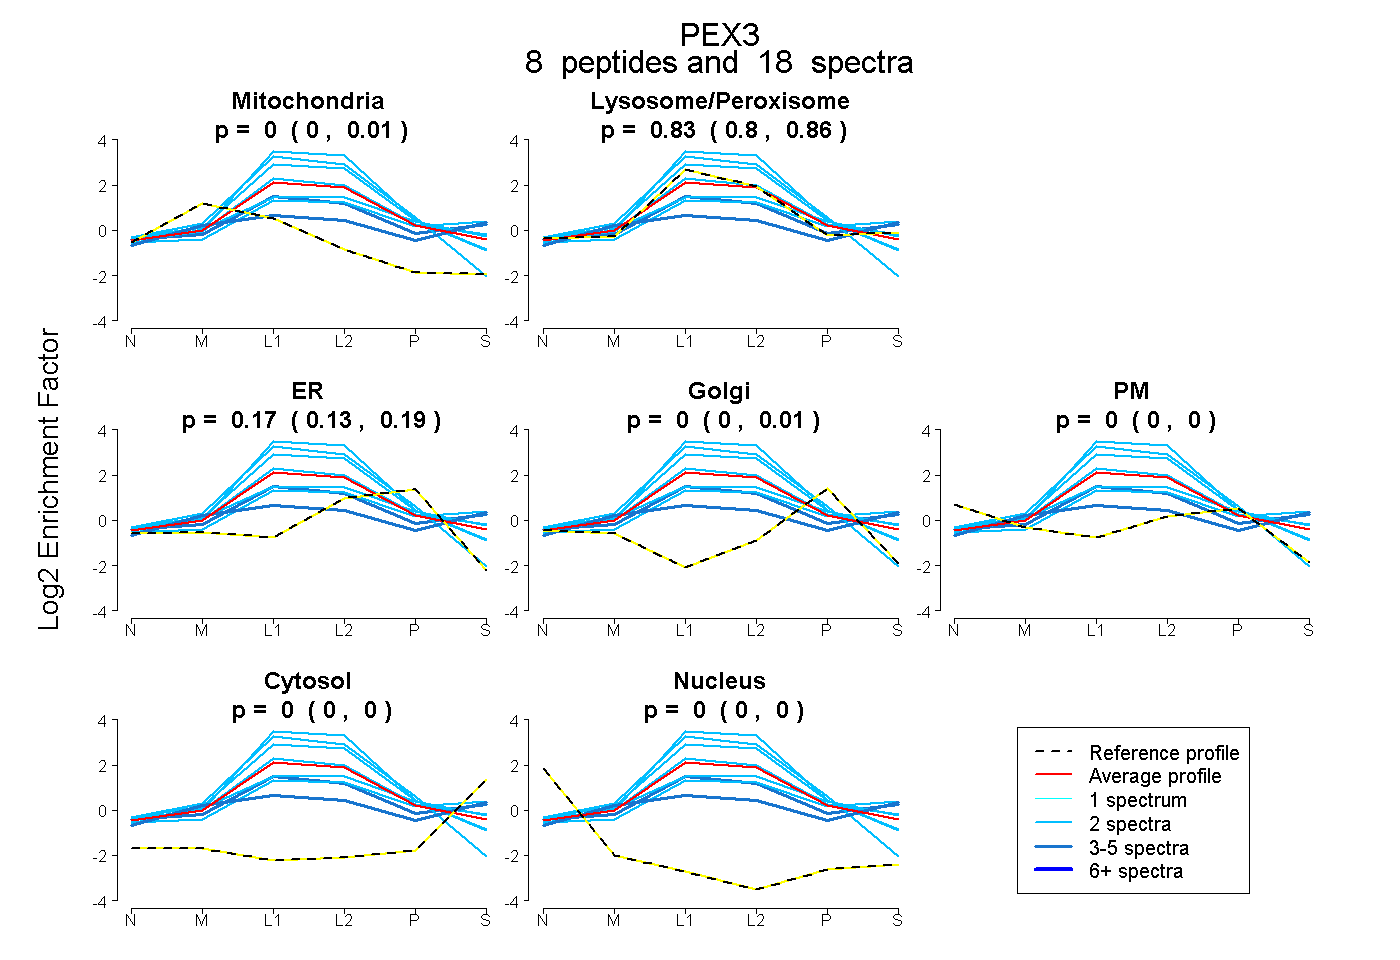
0.000 | 0.015
0.796 | 0.860
0.128 | 0.192
0.000 | 0.006
0.000 | 0.000
0.000 | 0.000
0.000 | 0.000