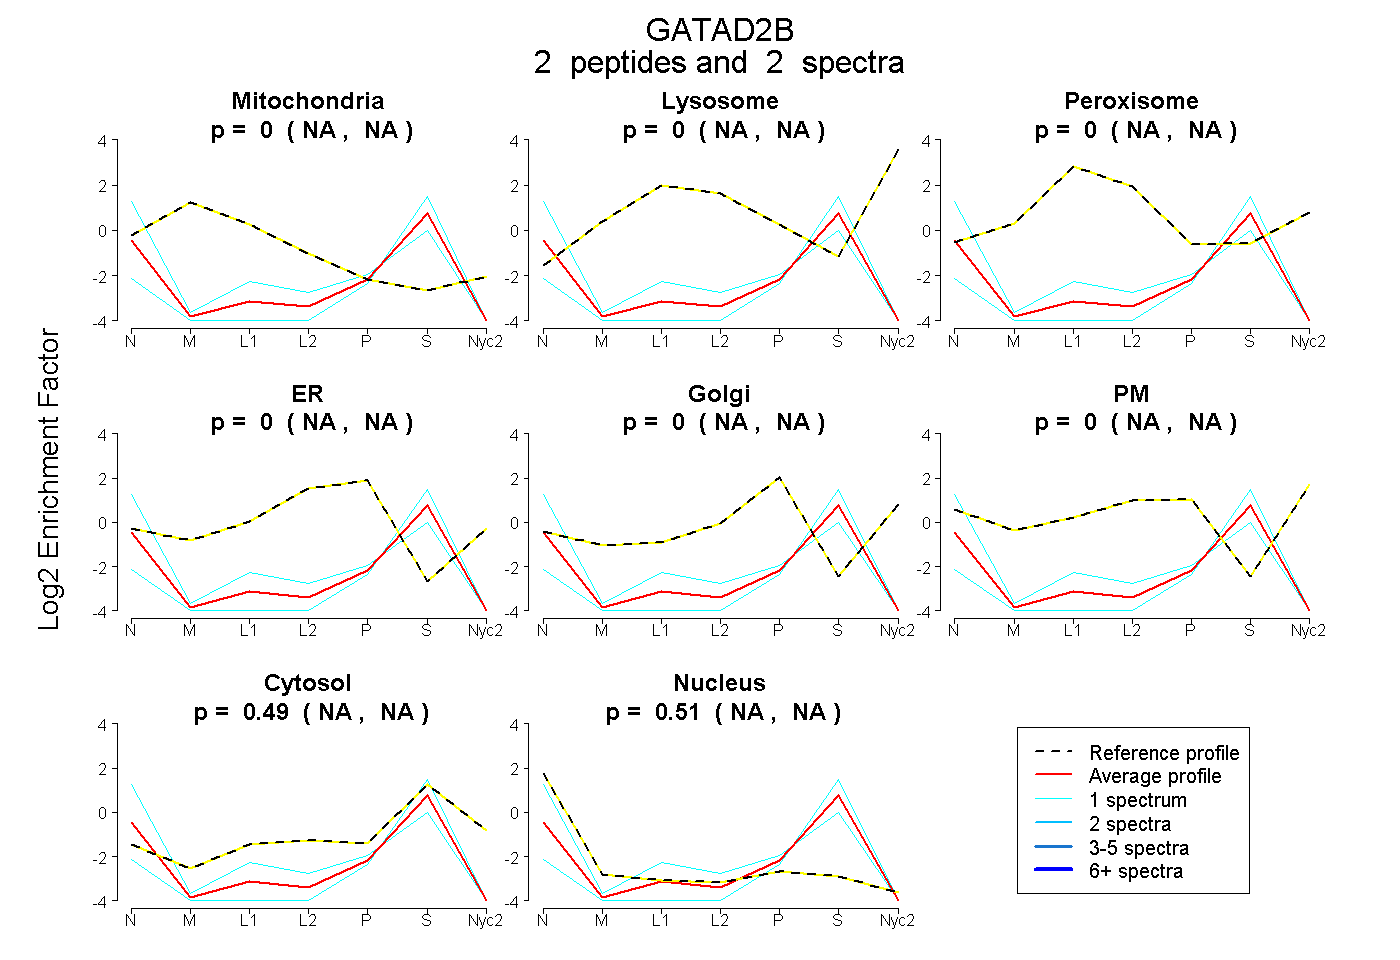
 2
2peptides
spectra
NA | NA
NA | NA
NA | NA
NA | NA
NA | NA
NA | NA
NA | NA
NA | NA
| Plot | Mito | Lyso | Perox | ER | Golgi | PM | Cytosol | Nucleus | |||||
| Expt A |
2 peptides |
2 spectra |
|
0.000 NA | NA |
0.000 NA | NA |
0.000 NA | NA |
0.000 NA | NA |
0.000 NA | NA |
0.000 NA | NA |
0.487 NA | NA |
0.513 NA | NA |
| 1 spectrum, LPSRPGAQGIEPQNLR | 0.000 | 0.000 | 0.000 | 0.000 | 0.000 | 0.000 | 0.356 | 0.644 | ||
| 1 spectrum, LVLLK | 0.000 | 0.000 | 0.000 | 0.000 | 0.000 | 0.000 | 0.617 | 0.383 |
| Plot | Lyso | Other | |||||||||||
| Expt C |
1 peptide |
10 spectra |
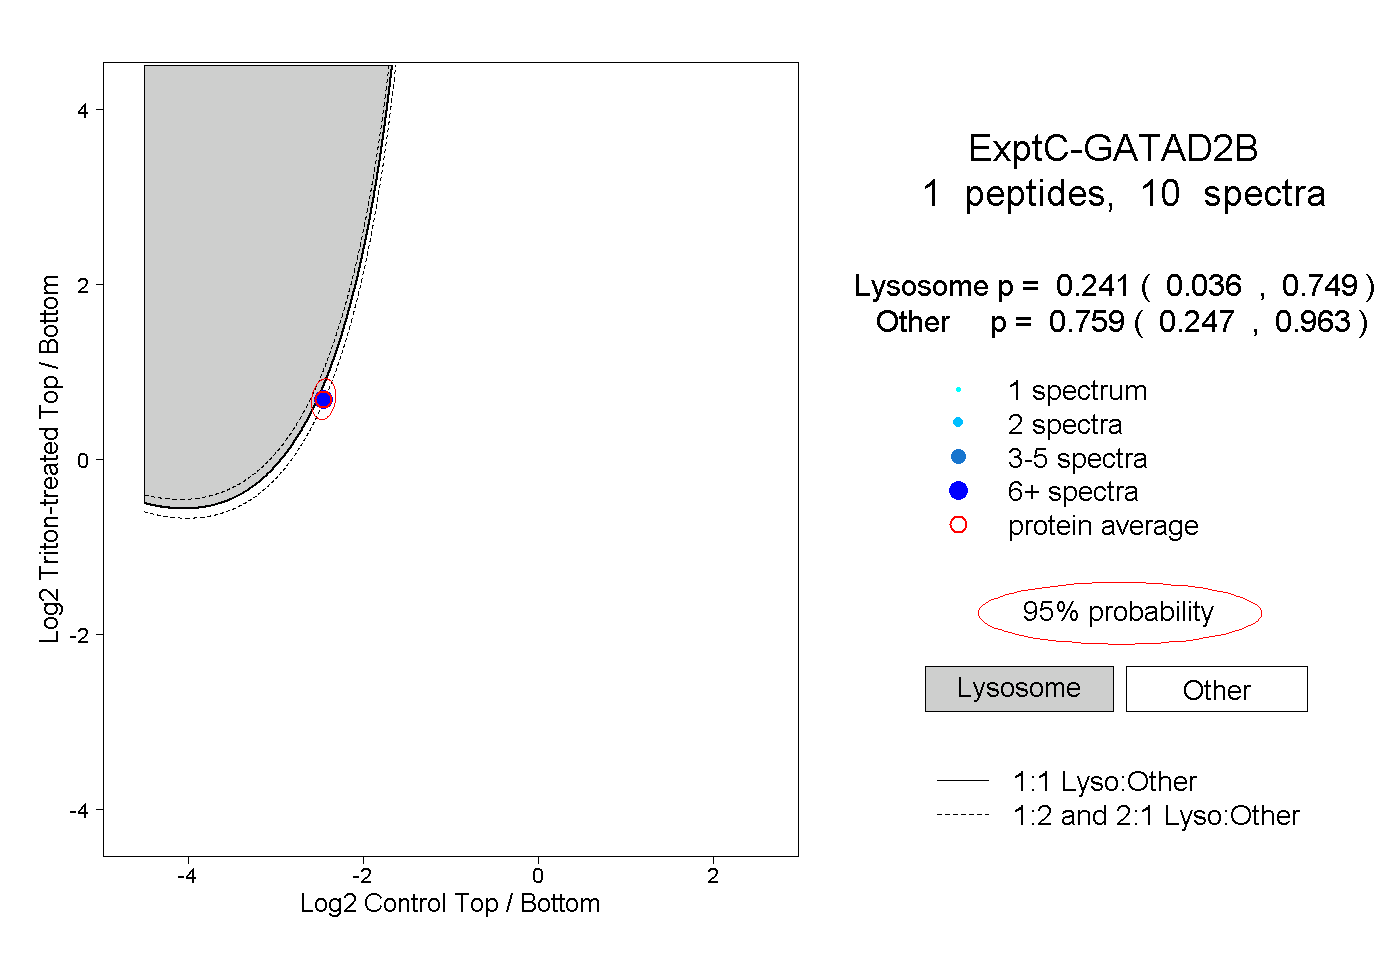 |
0.241 0.036 | 0.749 |
0.759 0.247 | 0.963 |