 1
1peptide
spectra
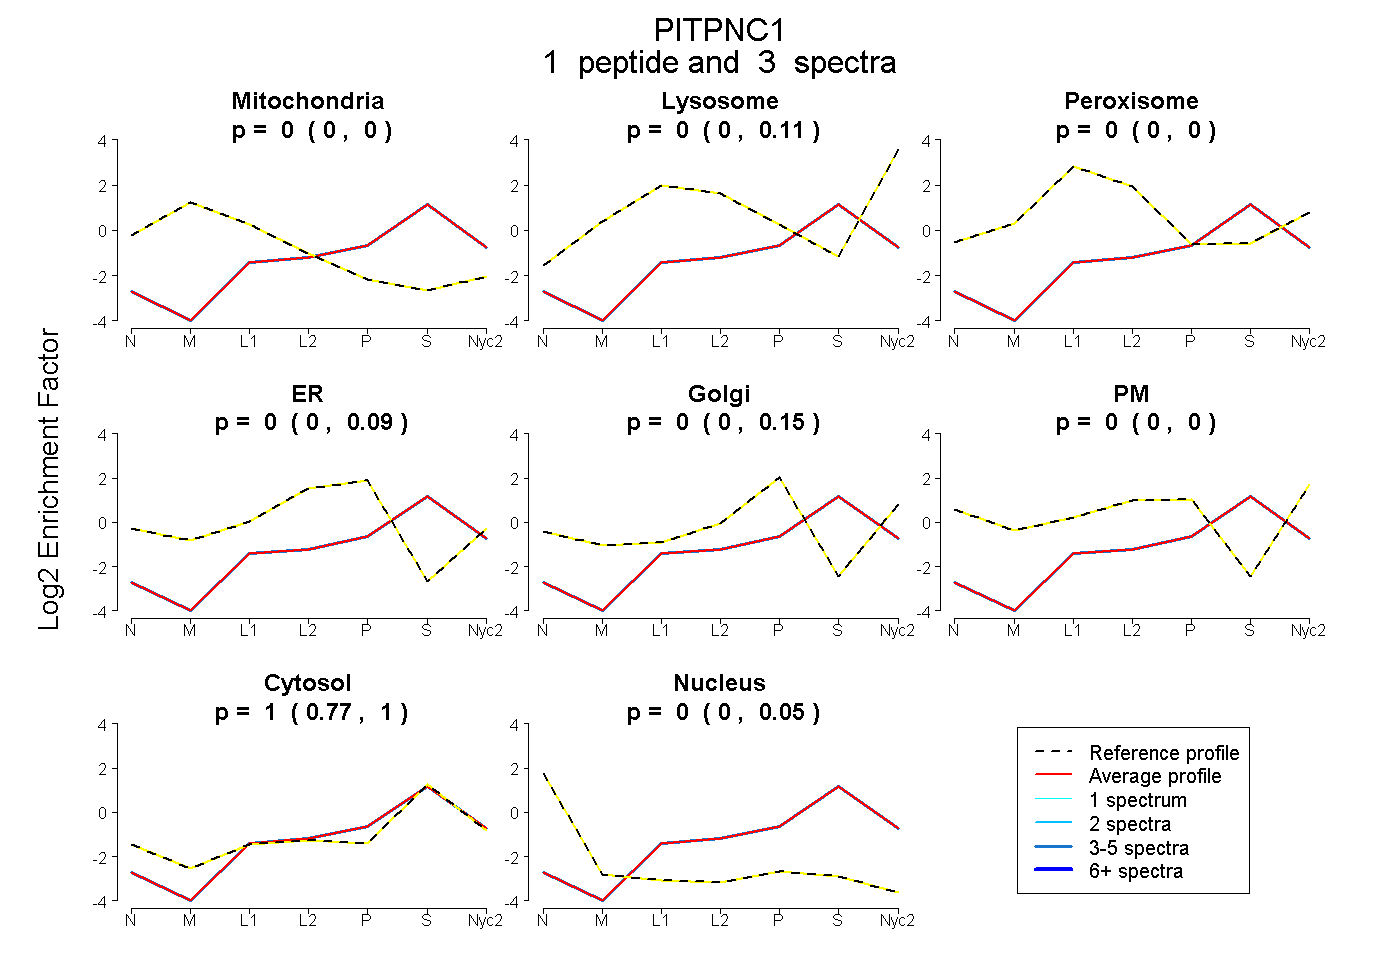
0.000 | 0.000
0.000 | 0.106
0.000 | 0.000
0.000 | 0.087
0.000 | 0.152
0.000 | 0.000
0.775 | 1.000
0.000 | 0.047
1peptide
spectrum
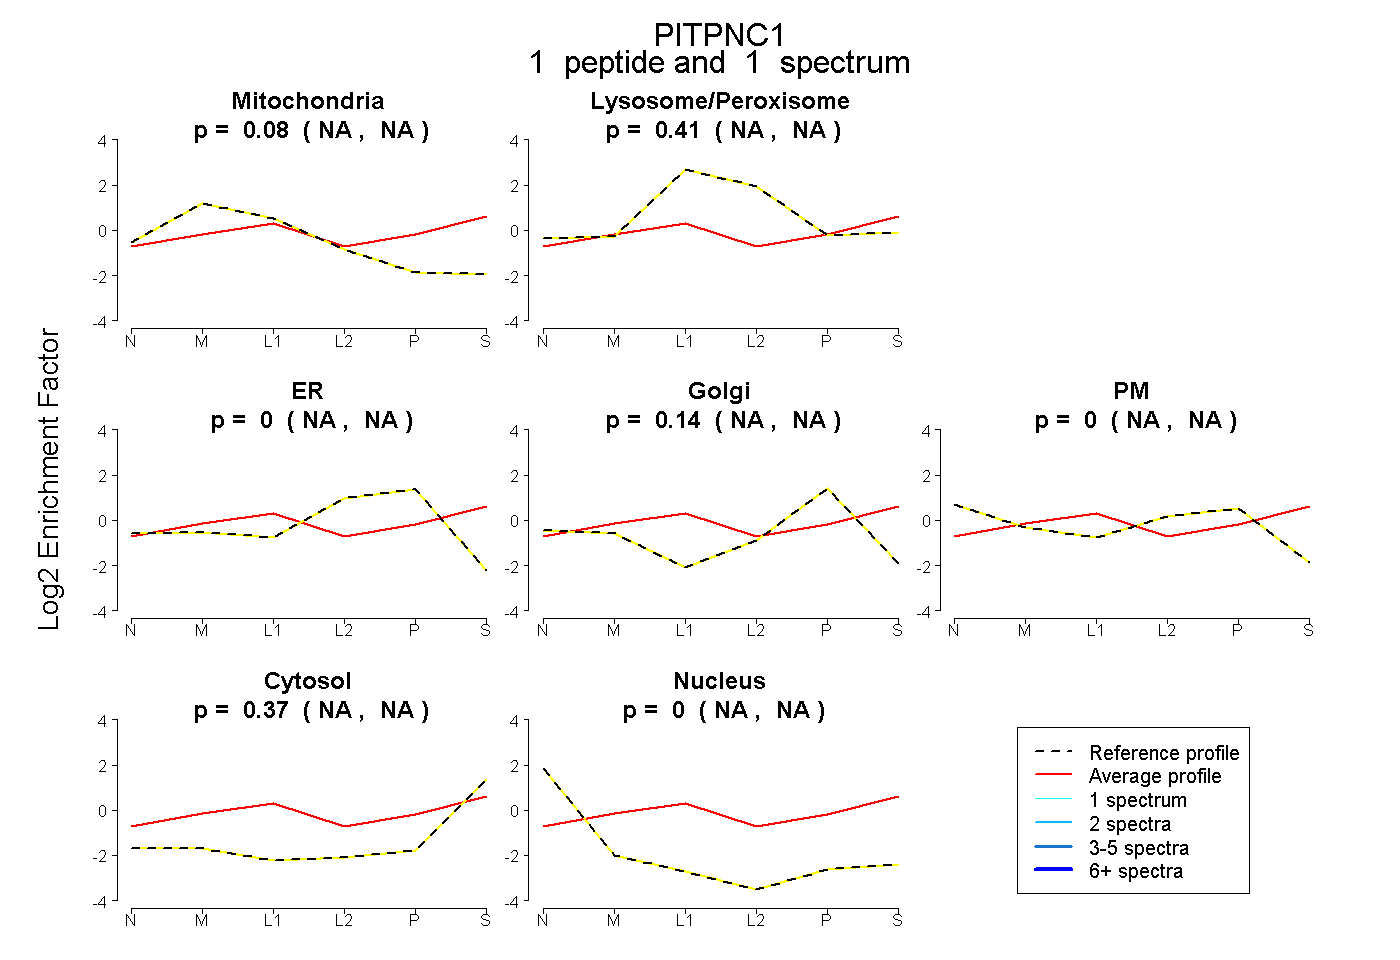
NA | NA
NA | NA
NA | NA
NA | NA
NA | NA
NA | NA
NA | NA
3peptides
spectra
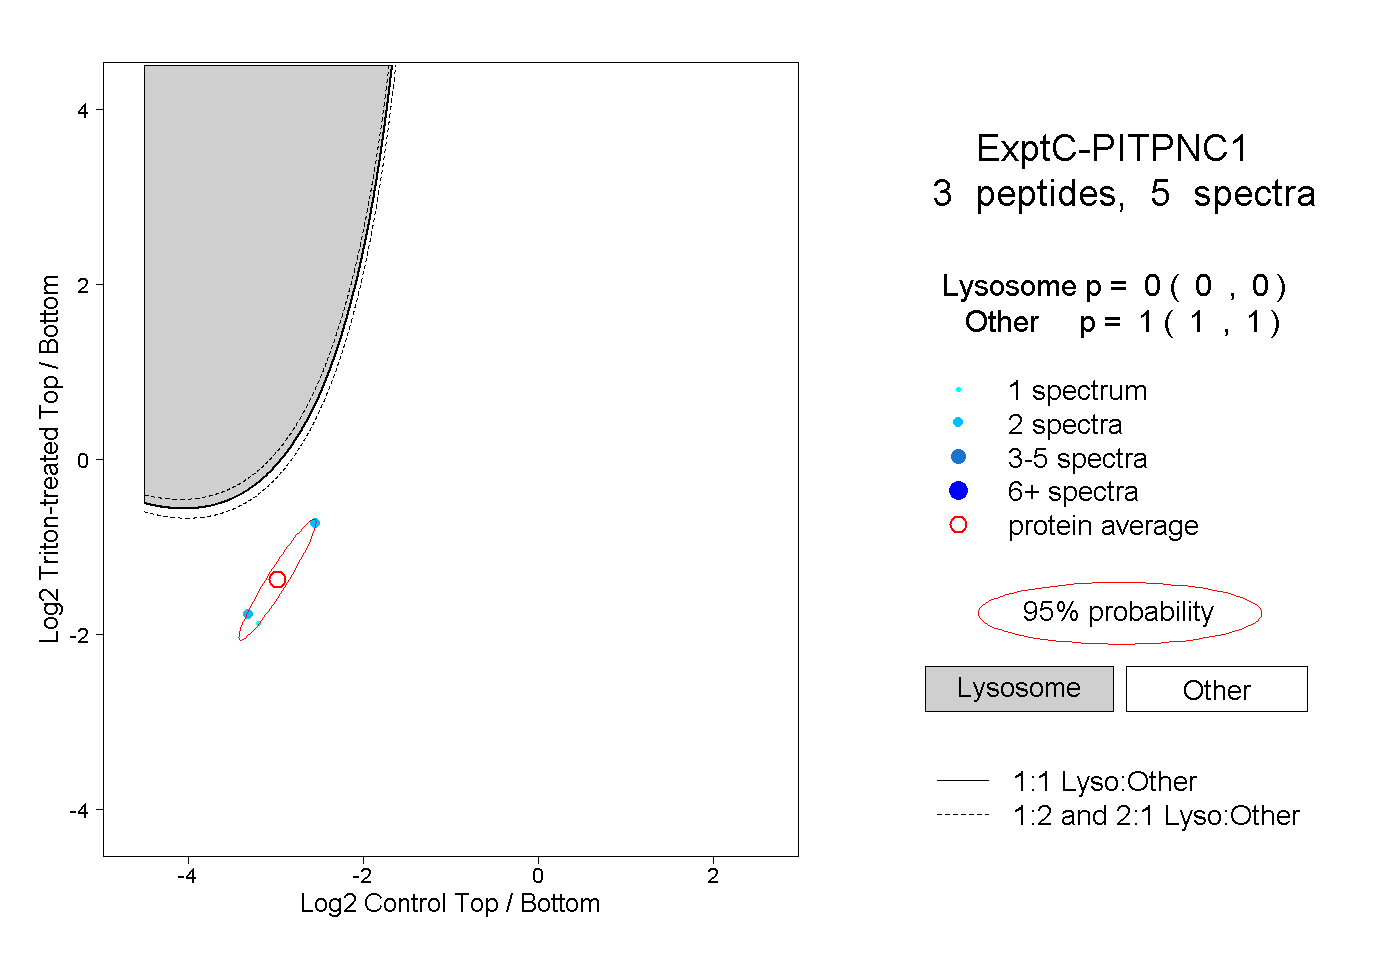
0.000 | 0.000
1.000 | 1.000