 6
6peptides
spectra
0.013 | 0.047
0.000 | 0.000
0.000 | 0.000
0.182 | 0.299
0.000 | 0.067
0.000 | 0.072
0.503 | 0.528
0.130 | 0.166
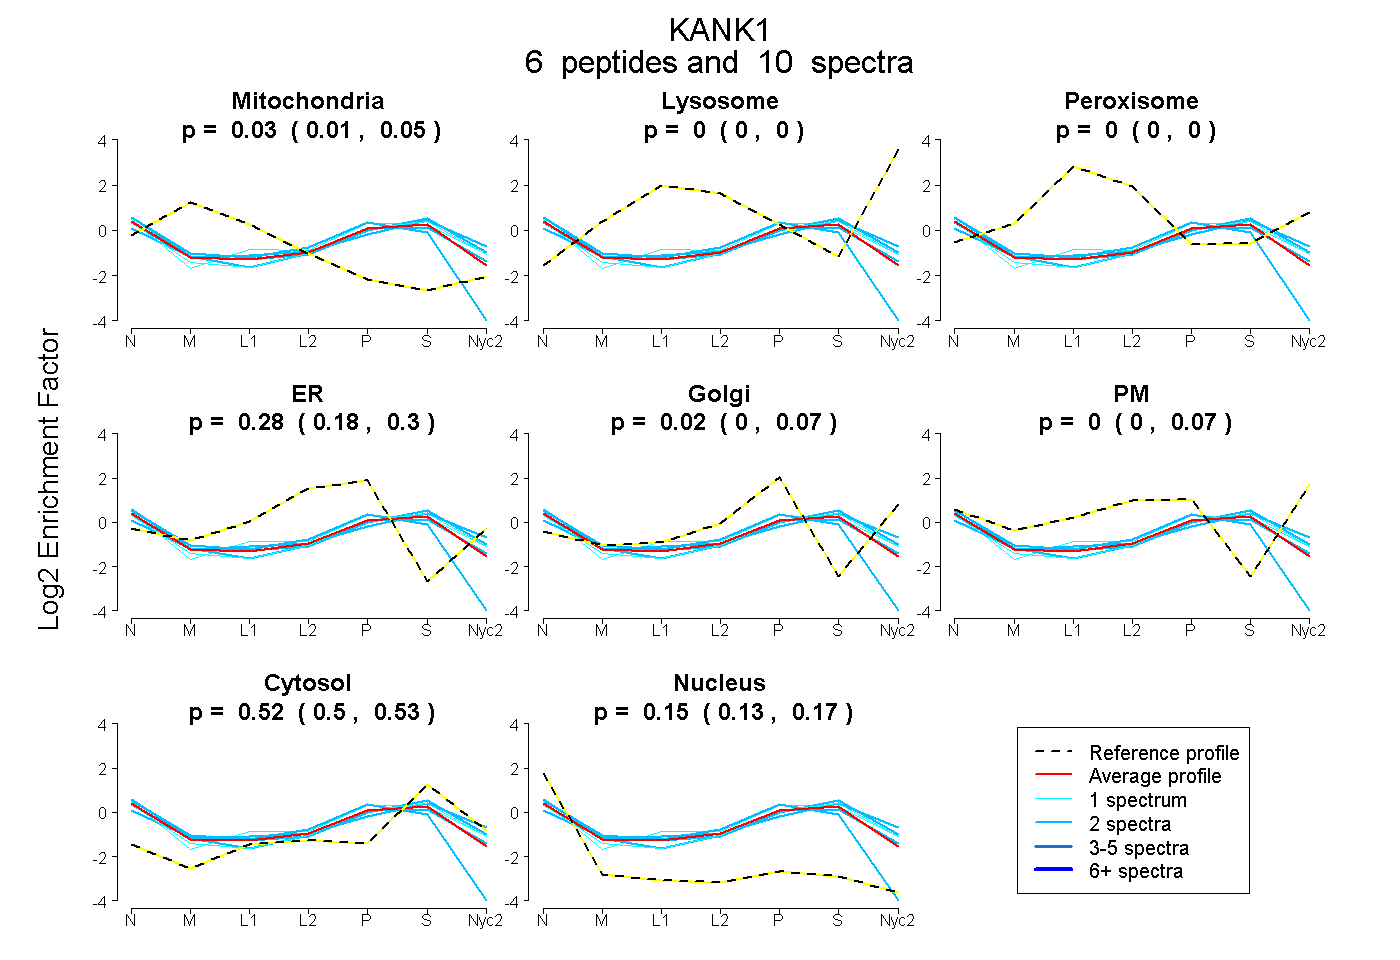
| Plot | Mito | Lyso | Perox | ER | Golgi | PM | Cytosol | Nucleus | |||||
| Expt A |
6 peptides |
10 spectra |
|
0.034 0.013 | 0.047 |
0.000 0.000 | 0.000 |
0.000 0.000 | 0.000 |
0.279 0.182 | 0.299 |
0.022 0.000 | 0.067 |
0.000 0.000 | 0.072 |
0.518 0.503 | 0.528 |
0.147 0.130 | 0.166 |
| 1 spectrum, QTSTQNVEMR | 0.000 | 0.000 | 0.000 | 0.066 | 0.189 | 0.061 | 0.549 | 0.135 | ||
| 2 spectra, QLTADMQALEQK | 0.070 | 0.000 | 0.000 | 0.031 | 0.180 | 0.069 | 0.591 | 0.058 | ||
| 2 spectra, LVEALVPTR | 0.010 | 0.000 | 0.000 | 0.157 | 0.116 | 0.053 | 0.473 | 0.191 | ||
| 2 spectra, AIMAQPLVFSK | 0.093 | 0.000 | 0.000 | 0.292 | 0.000 | 0.000 | 0.305 | 0.310 | ||
| 1 spectrum, AASQNEACGVR | 0.000 | 0.000 | 0.000 | 0.224 | 0.006 | 0.129 | 0.525 | 0.117 | ||
| 2 spectra, DTAVGTVTETR | 0.027 | 0.000 | 0.000 | 0.000 | 0.000 | 0.308 | 0.574 | 0.090 |
| Plot | Lyso | Other | |||||||||||
| Expt C |
5 peptides |
9 spectra |
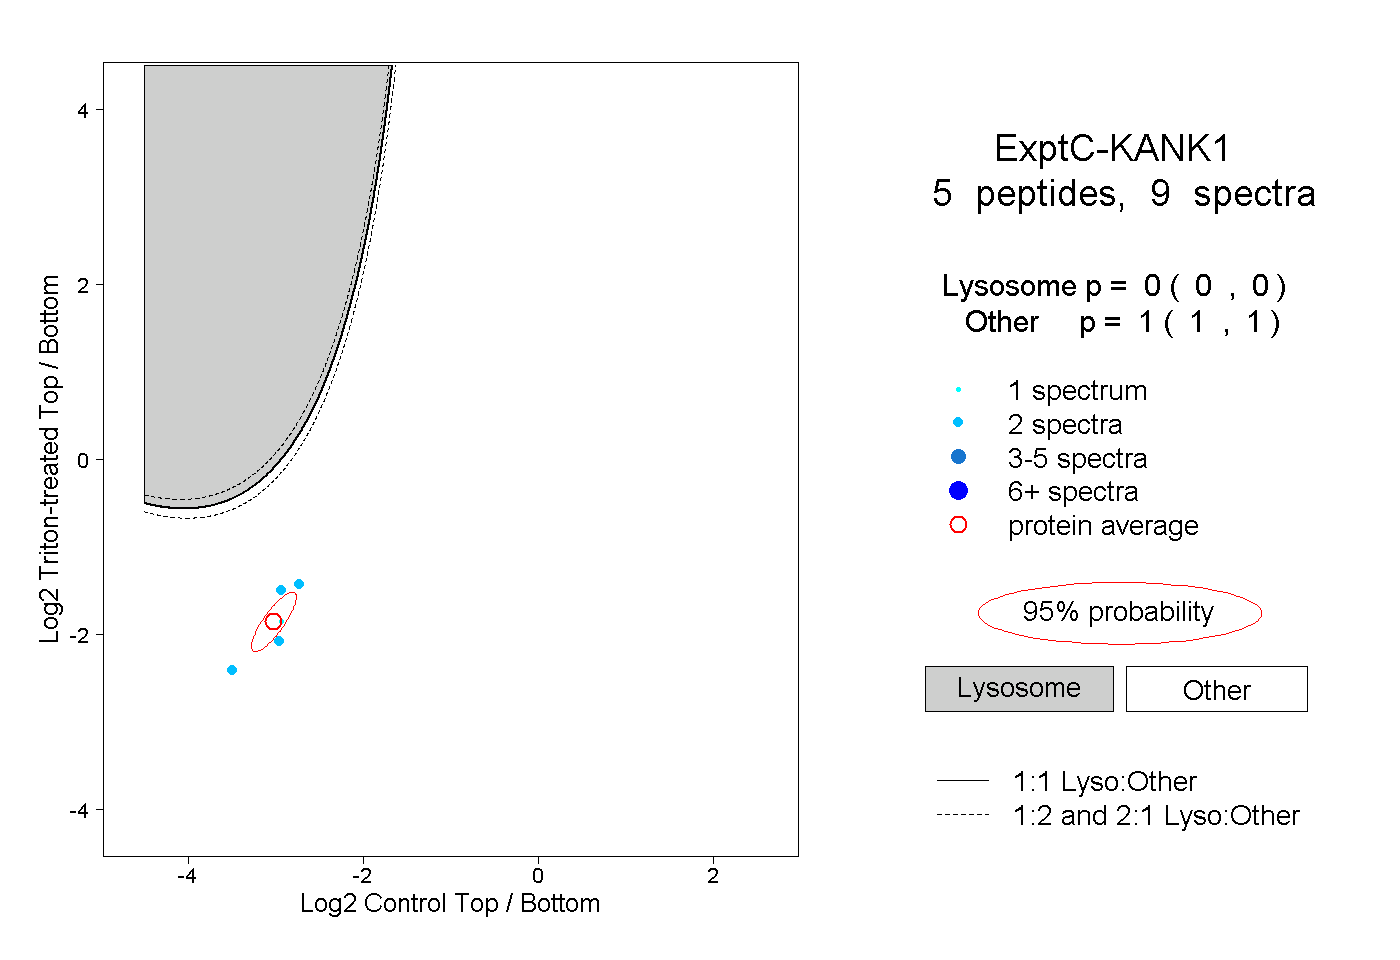 |
0.000 0.000 | 0.000 |
1.000 1.000 | 1.000 |