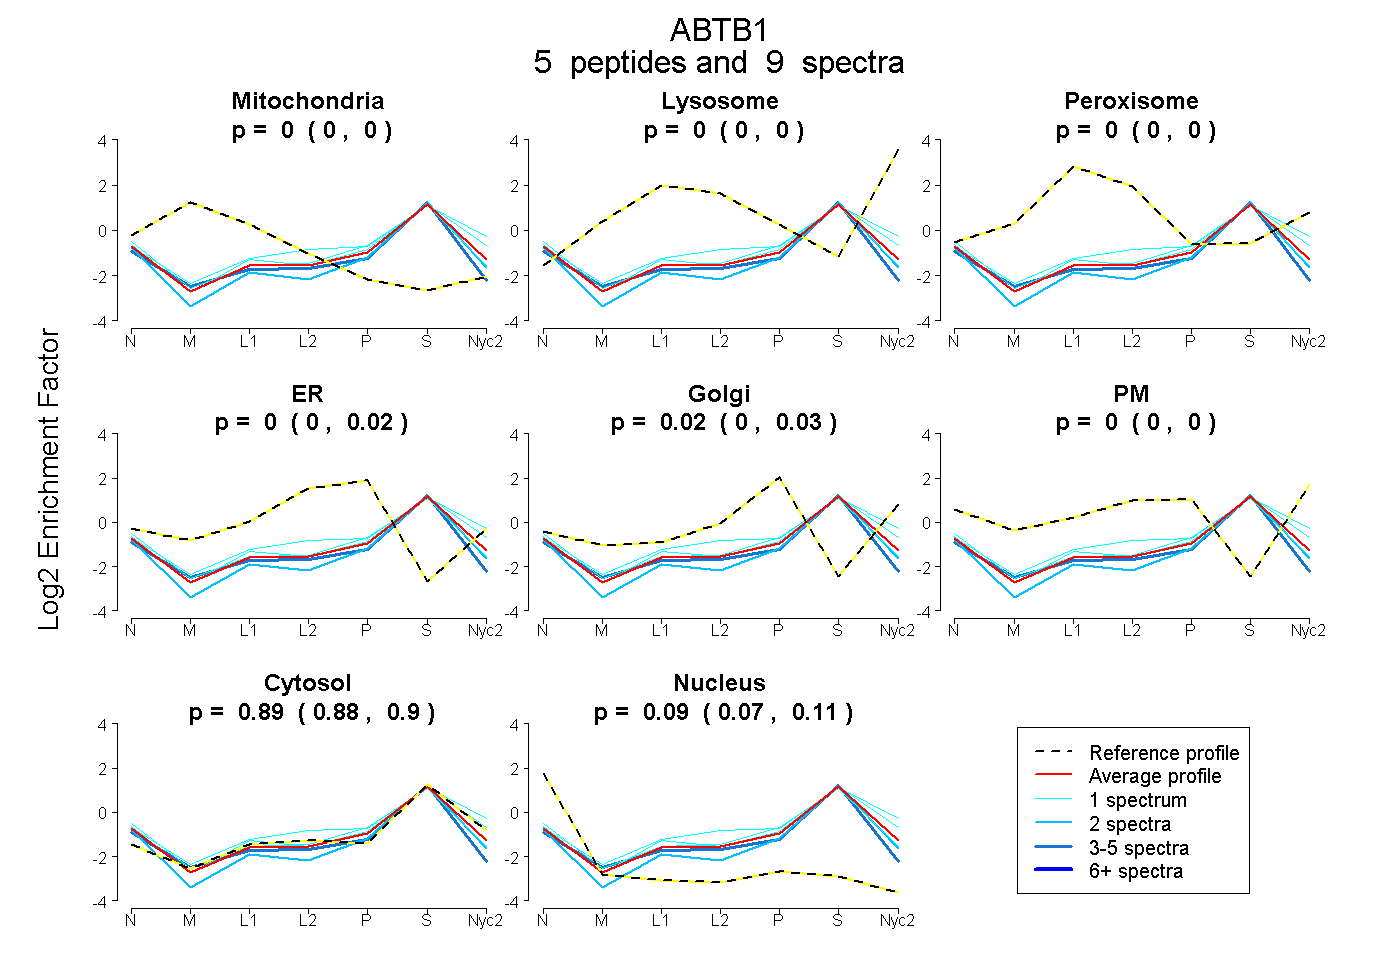
 5
5peptides
spectra
0.000 | 0.000
0.000 | 0.000
0.000 | 0.000
0.000 | 0.020
0.000 | 0.034
0.000 | 0.000
0.878 | 0.895
0.075 | 0.110
| Plot | Mito | Lyso | Perox | ER | Golgi | PM | Cytosol | Nucleus | |||||
| Expt A |
5 peptides |
9 spectra |
|
0.000 0.000 | 0.000 |
0.000 0.000 | 0.000 |
0.000 0.000 | 0.000 |
0.000 0.000 | 0.020 |
0.018 0.000 | 0.034 |
0.000 0.000 | 0.000 |
0.888 0.878 | 0.895 |
0.094 0.075 | 0.110 |
| 1 spectrum, VSEFVASKPGTCVK | 0.000 | 0.000 | 0.000 | 0.056 | 0.000 | 0.000 | 0.829 | 0.115 | ||
| 1 spectrum, YLLEQR | 0.000 | 0.000 | 0.000 | 0.000 | 0.061 | 0.011 | 0.887 | 0.041 | ||
| 4 spectra, AFFCGR | 0.000 | 0.000 | 0.000 | 0.000 | 0.000 | 0.000 | 0.844 | 0.156 | ||
| 2 spectra, DYYDDFLQR | 0.000 | 0.000 | 0.000 | 0.000 | 0.000 | 0.000 | 0.842 | 0.158 | ||
| 1 spectrum, EEAAAVAAR | 0.000 | 0.000 | 0.000 | 0.000 | 0.000 | 0.161 | 0.839 | 0.000 |
| Plot | Mito | Lyso or Perox | ER | Golgi | PM | Cytosol | Nucleus | ||||||
| Expt B |
1 peptide |
2 spectra |
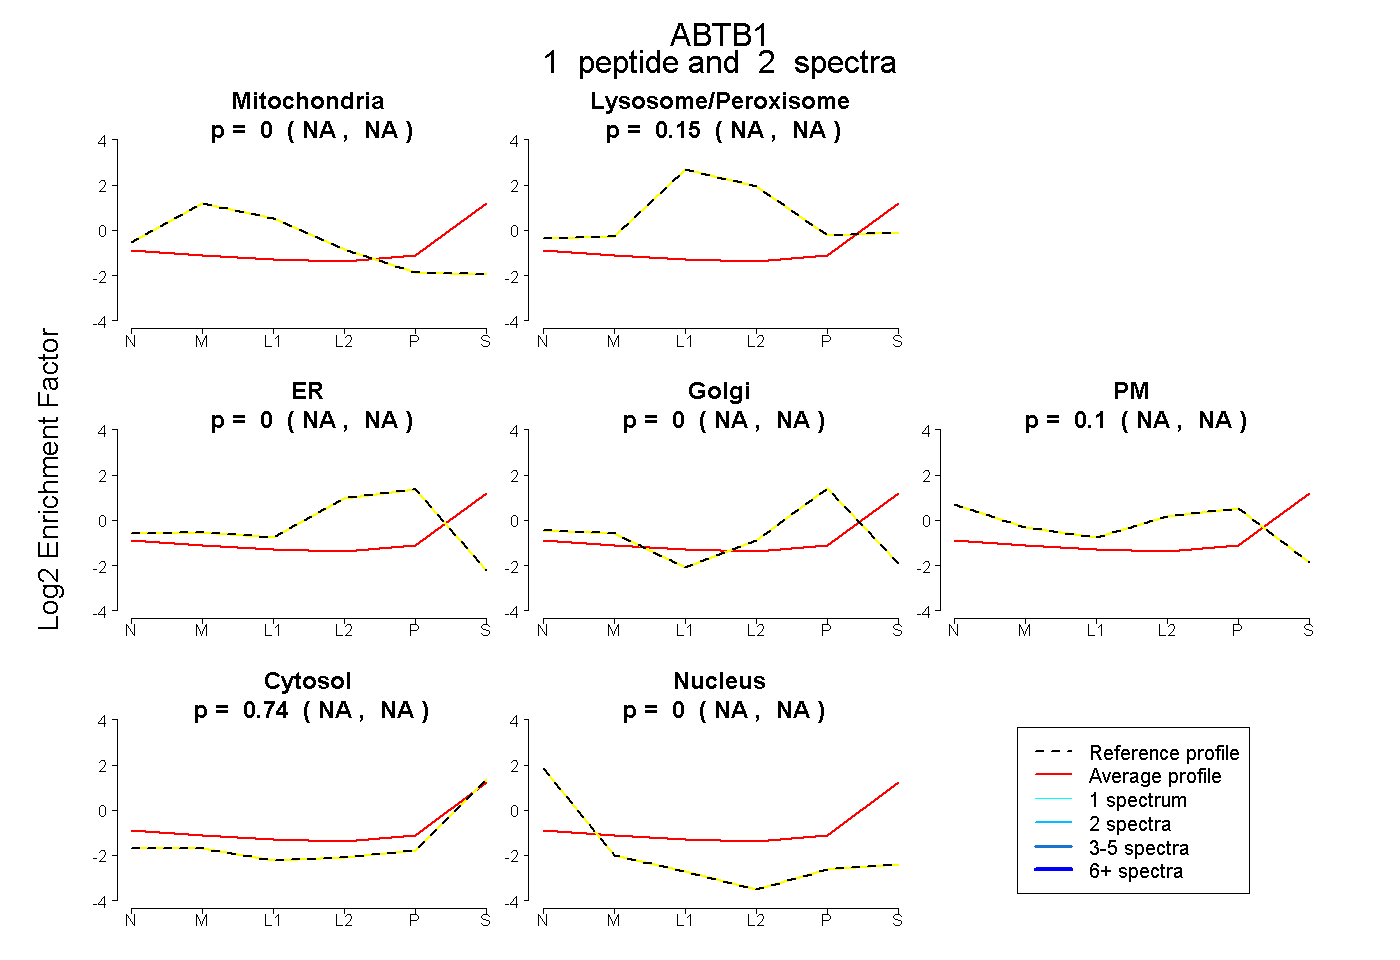 |
0.000 NA | NA |
0.154 NA | NA |
0.000 NA | NA |
0.000 NA | NA |
0.104 NA | NA |
0.742 NA | NA |
0.000 NA | NA |
|||
| Plot | Lyso | Other | |||||||||||
| Expt C |
4 peptides |
6 spectra |
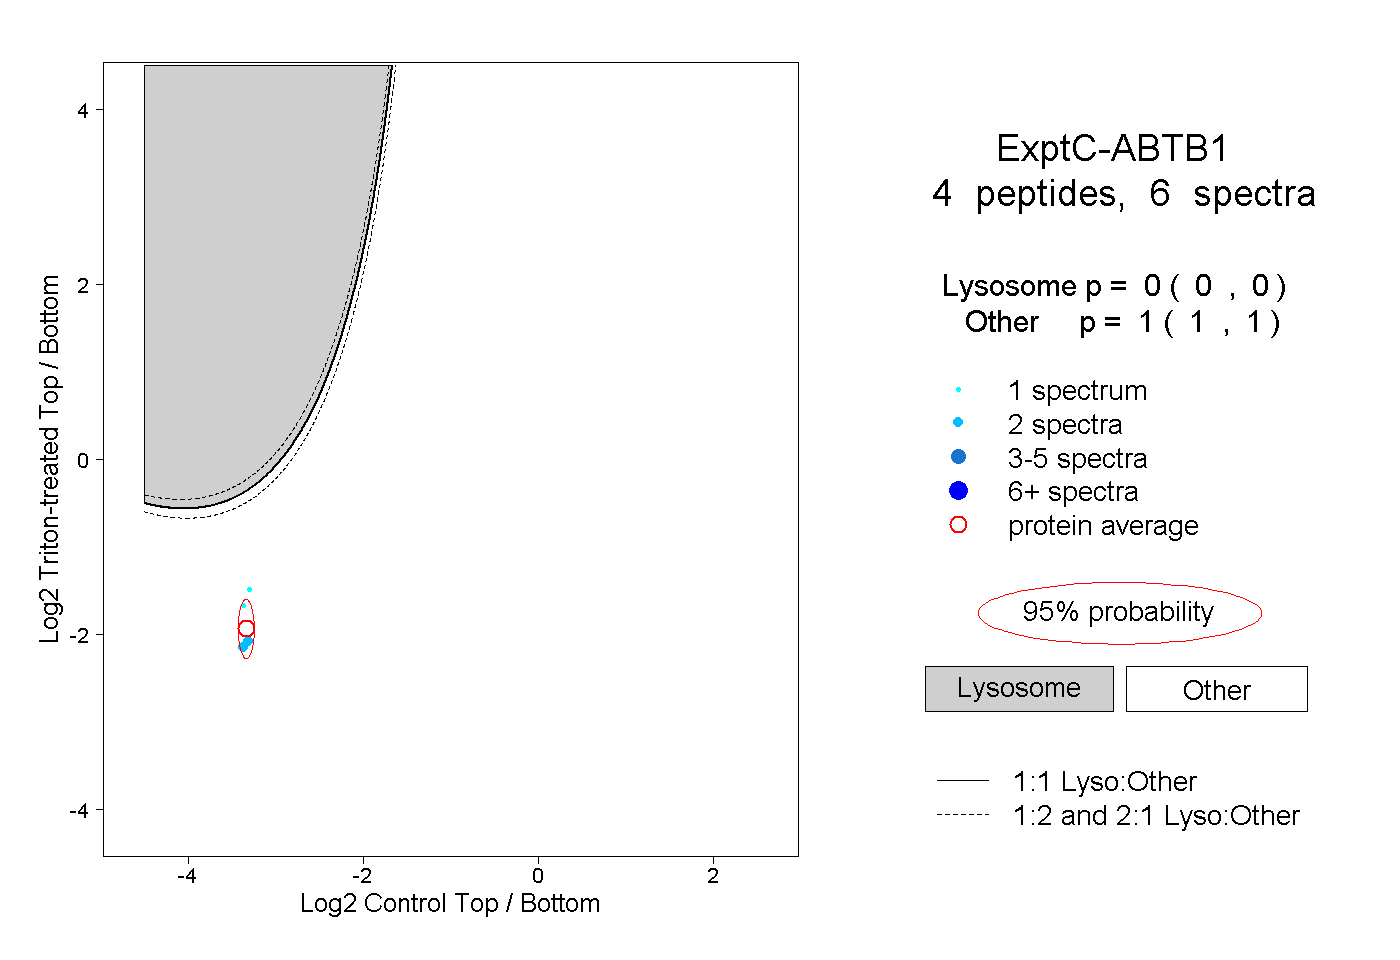 |
0.000 0.000 | 0.000 |
1.000 1.000 | 1.000 |