 2
2peptides
spectra
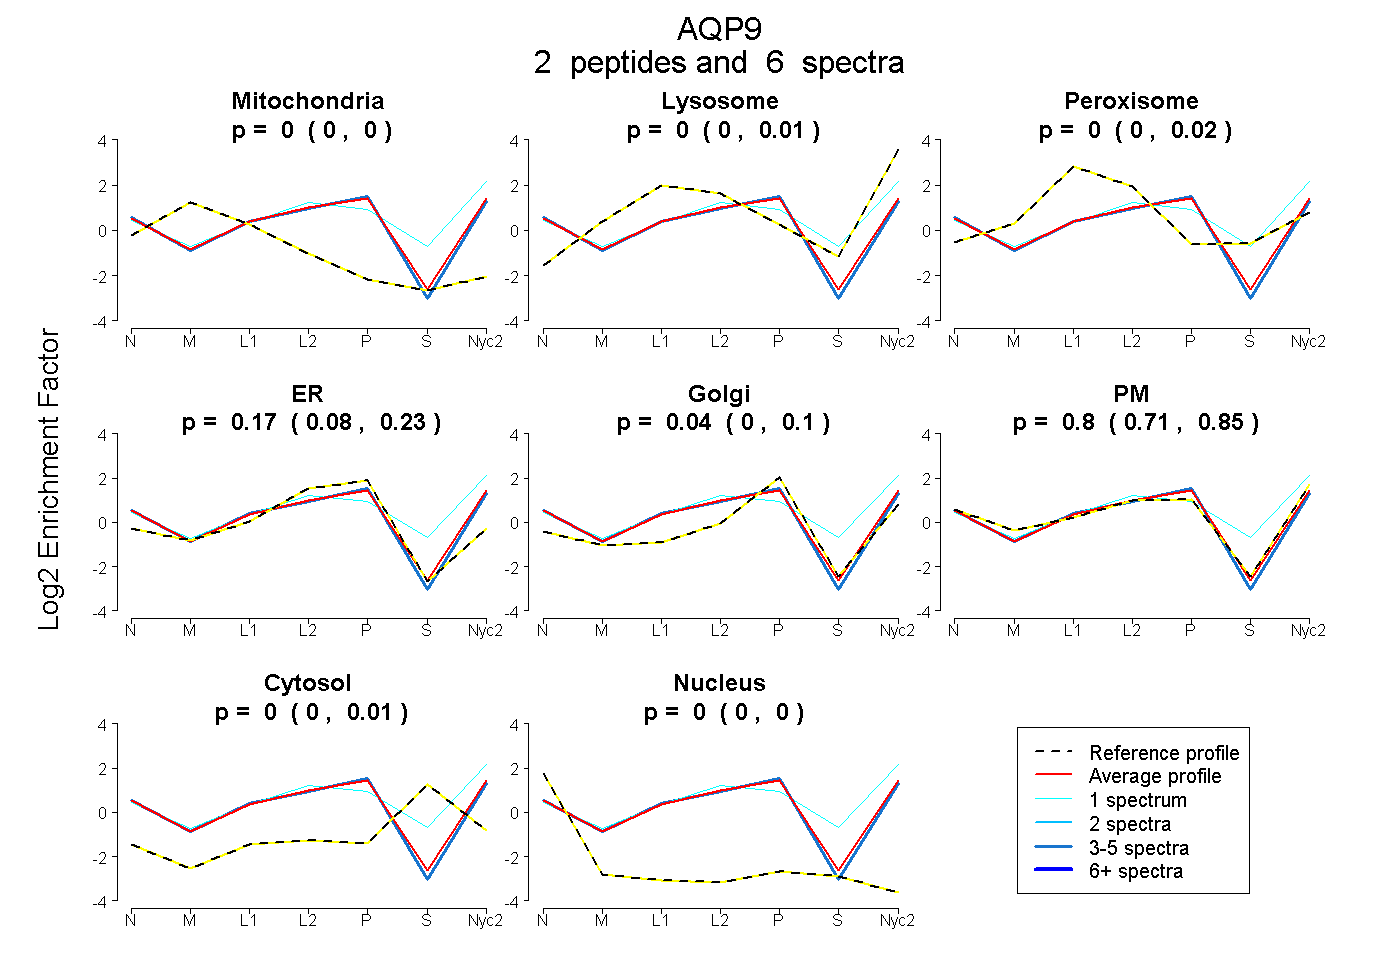
0.000 | 0.000
0.000 | 0.015
0.000 | 0.024
0.079 | 0.228
0.000 | 0.101
0.707 | 0.850
0.000 | 0.007
0.000 | 0.003
1peptide
spectra
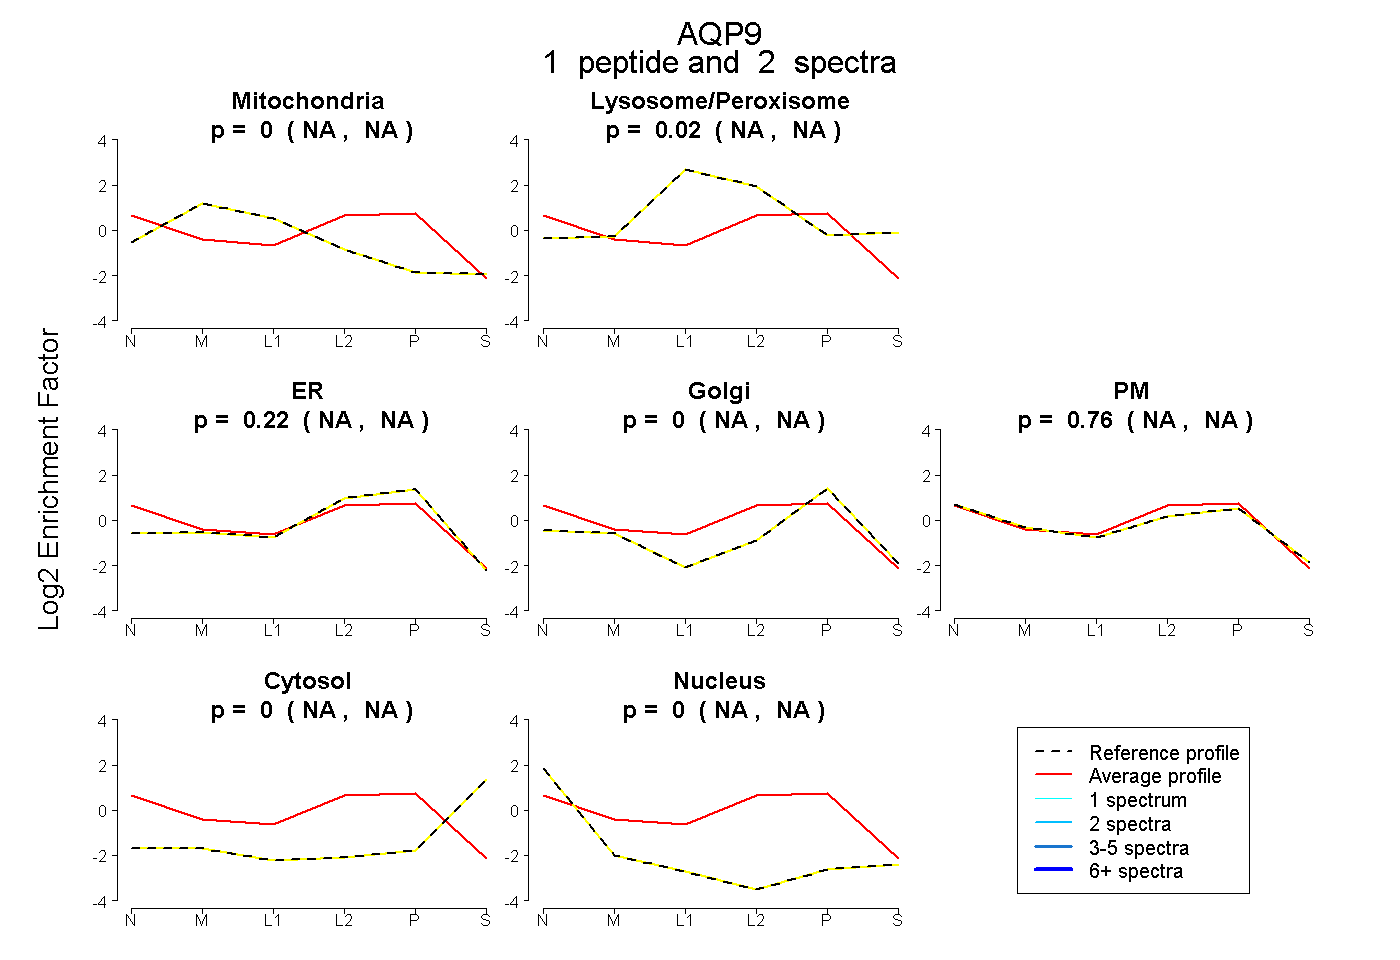
NA | NA
NA | NA
NA | NA
NA | NA
NA | NA
NA | NA
NA | NA
2peptides
spectra
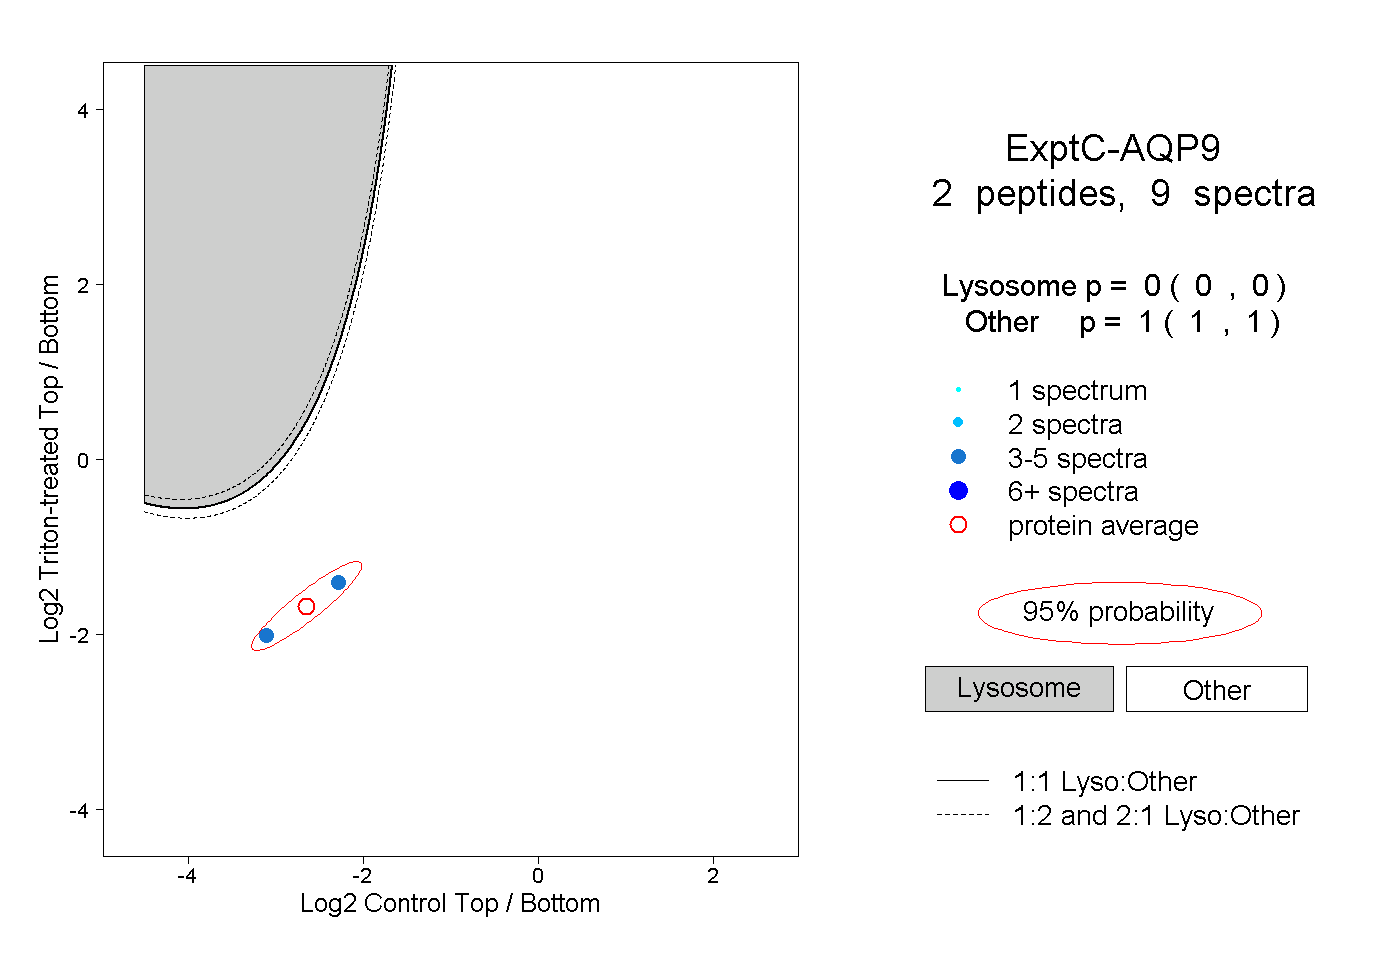
0.000 | 0.000
1.000 | 1.000