 3
3peptides
spectra
0.000 | 0.000
0.000 | 0.000
0.000 | 0.000
0.282 | 0.426
0.000 | 0.000
0.000 | 0.050
0.416 | 0.547
0.027 | 0.191
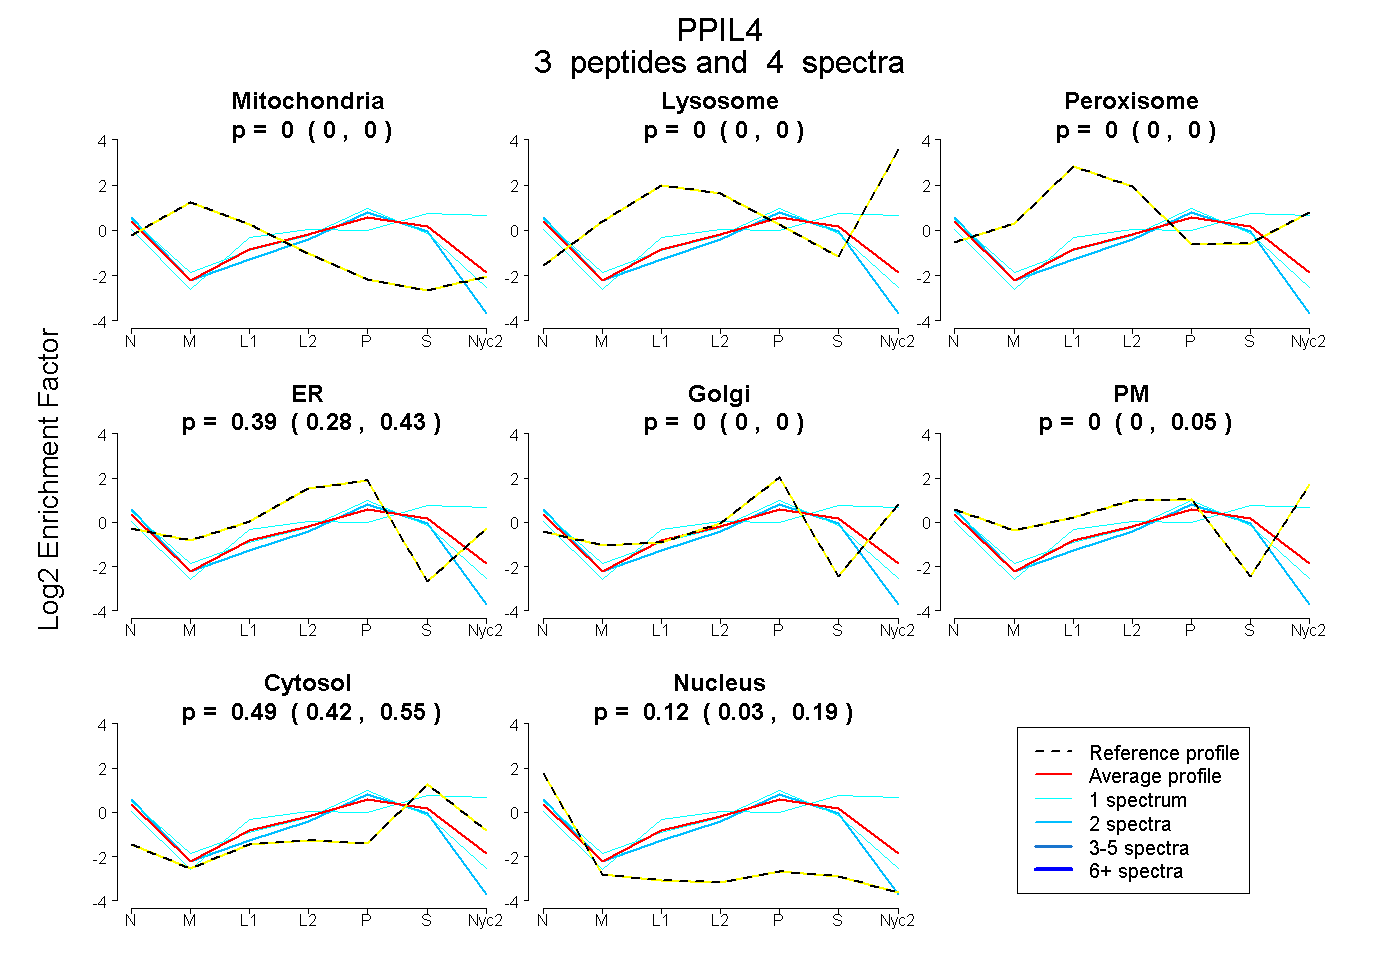
| Plot | Mito | Lyso | Perox | ER | Golgi | PM | Cytosol | Nucleus | |||||
| Expt A |
3 peptides |
4 spectra |
|
0.000 0.000 | 0.000 |
0.000 0.000 | 0.000 |
0.000 0.000 | 0.000 |
0.390 0.282 | 0.426 |
0.000 0.000 | 0.000 |
0.000 0.000 | 0.050 |
0.492 0.416 | 0.547 |
0.119 0.027 | 0.191 |
| 1 spectrum, IGADEEIDDFK | 0.000 | 0.030 | 0.043 | 0.000 | 0.000 | 0.325 | 0.602 | 0.000 | ||
| 1 spectrum, SAEEVEEIK | 0.000 | 0.000 | 0.000 | 0.449 | 0.000 | 0.000 | 0.365 | 0.186 | ||
| 2 spectra, DFIIQTGDPTGTGR | 0.000 | 0.000 | 0.000 | 0.352 | 0.000 | 0.000 | 0.347 | 0.301 |