 1
1peptide
spectra
0.269 | 0.472
0.000 | 0.053
0.000 | 0.249
0.081 | 0.530
0.000 | 0.216
0.000 | 0.293
0.000 | 0.044
0.000 | 0.000
8peptides
spectra
0.000 | 0.008
0.992 | 1.000
| Plot | Mito | Lyso | Perox | ER | Golgi | PM | Cytosol | Nucleus | |||||
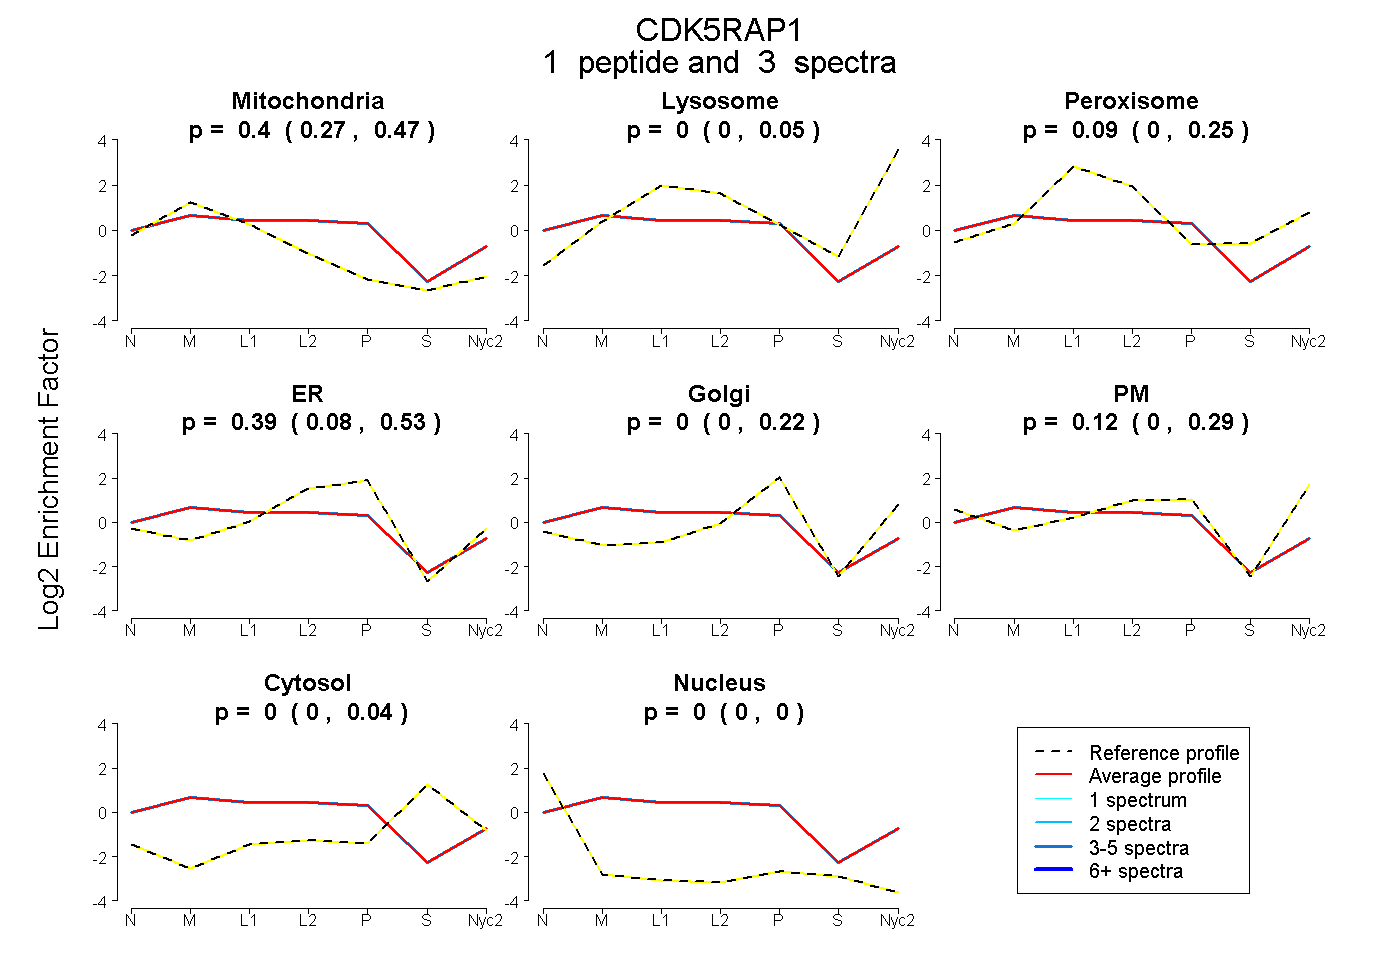
| Expt A |
1 peptide |
3 spectra |
|
0.395 0.269 | 0.472 |
0.000 0.000 | 0.053 |
0.092 0.000 | 0.249 |
0.391 0.081 | 0.530 |
0.000 0.000 | 0.216 |
0.122 0.000 | 0.293 |
0.000 0.000 | 0.044 |
0.000 0.000 | 0.000 |
||
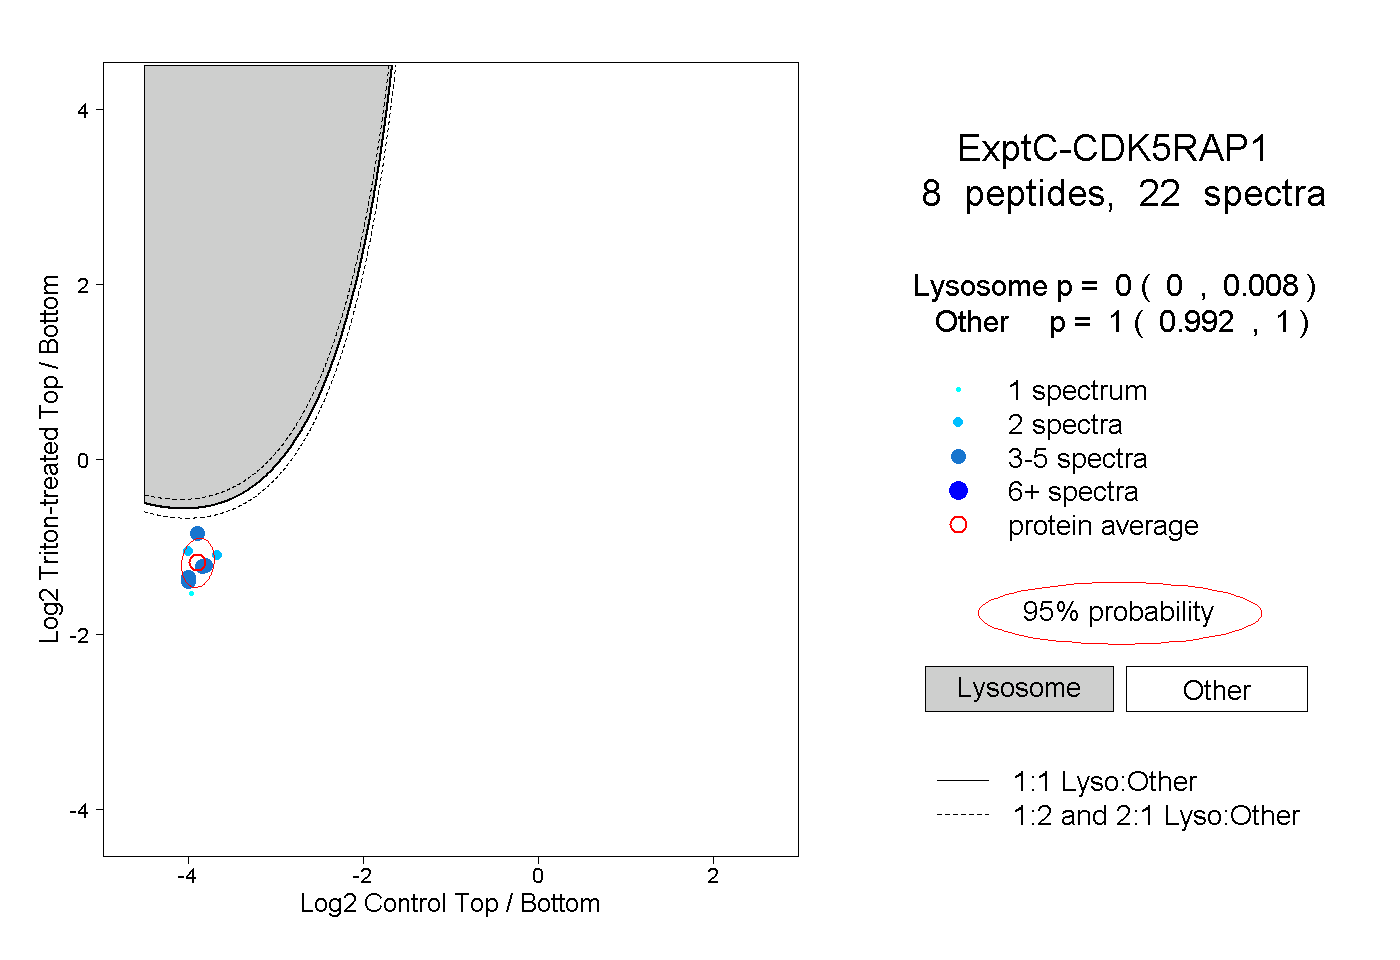
| Plot | Lyso | Other | |||||||||||
| Expt C |
8 peptides |
22 spectra |
|
0.000 0.000 | 0.008 |
1.000 0.992 | 1.000 |