 9
9peptides
spectra
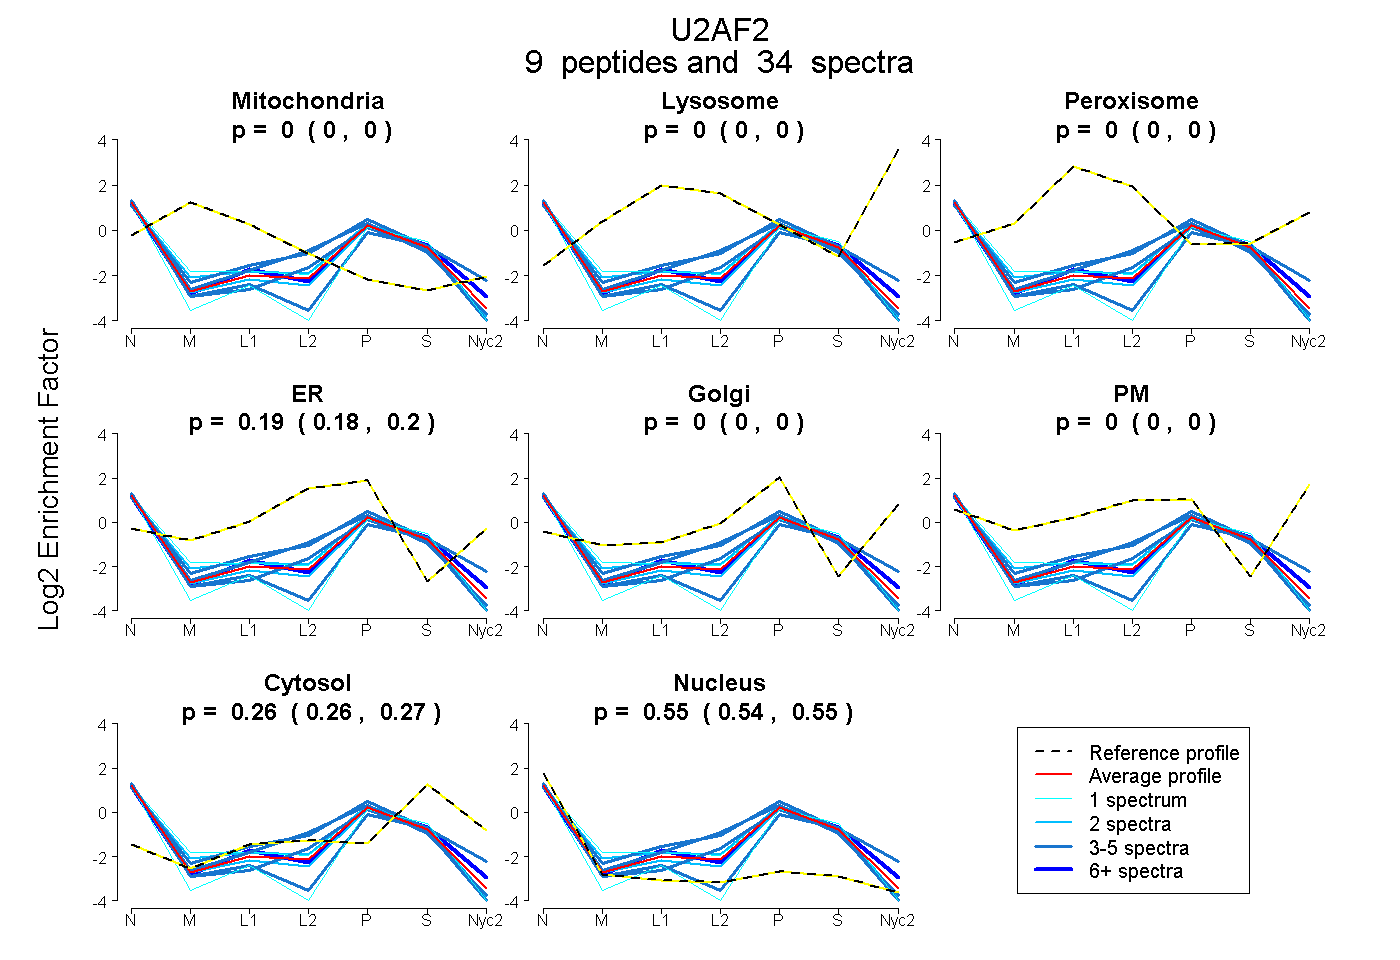
0.000 | 0.000
0.000 | 0.000
0.000 | 0.000
0.184 | 0.201
0.000 | 0.000
0.000 | 0.000
0.256 | 0.266
0.537 | 0.553
| Plot | Mito | Lyso | Perox | ER | Golgi | PM | Cytosol | Nucleus | |||||
| Expt A |
9 peptides |
34 spectra |
|
0.000 0.000 | 0.000 |
0.000 0.000 | 0.000 |
0.000 0.000 | 0.000 |
0.193 0.184 | 0.201 |
0.000 0.000 | 0.000 |
0.000 0.000 | 0.000 |
0.261 0.256 | 0.266 |
0.545 0.537 | 0.553 |
| 3 spectra, IFVEFTSVFDCQK | 0.000 | 0.000 | 0.000 | 0.000 | 0.039 | 0.000 | 0.269 | 0.692 | ||
| 1 spectrum, ELLTSFGPLK | 0.000 | 0.000 | 0.000 | 0.241 | 0.000 | 0.000 | 0.190 | 0.569 | ||
| 3 spectra, EEHGGLIR | 0.000 | 0.000 | 0.000 | 0.362 | 0.000 | 0.000 | 0.283 | 0.355 | ||
| 2 spectra, ASVGAK | 0.000 | 0.000 | 0.000 | 0.243 | 0.000 | 0.000 | 0.232 | 0.525 | ||
| 4 spectra, NFAFLEFR | 0.000 | 0.000 | 0.000 | 0.187 | 0.000 | 0.000 | 0.207 | 0.606 | ||
| 1 spectrum, SIEIPRPVDGVEVPGCGK | 0.000 | 0.000 | 0.000 | 0.000 | 0.000 | 0.000 | 0.313 | 0.687 | ||
| 2 spectra, LFIGGLPNYLNDDQVK | 0.000 | 0.000 | 0.000 | 0.149 | 0.000 | 0.000 | 0.233 | 0.618 | ||
| 3 spectra, SDFDEFER | 0.000 | 0.000 | 0.000 | 0.321 | 0.000 | 0.000 | 0.173 | 0.506 | ||
| 15 spectra, AMQGLTGR | 0.000 | 0.000 | 0.000 | 0.134 | 0.074 | 0.000 | 0.297 | 0.495 |
| Plot | Mito | Lyso or Perox | ER | Golgi | PM | Cytosol | Nucleus | ||||||
| Expt B |
3 peptides |
4 spectra |
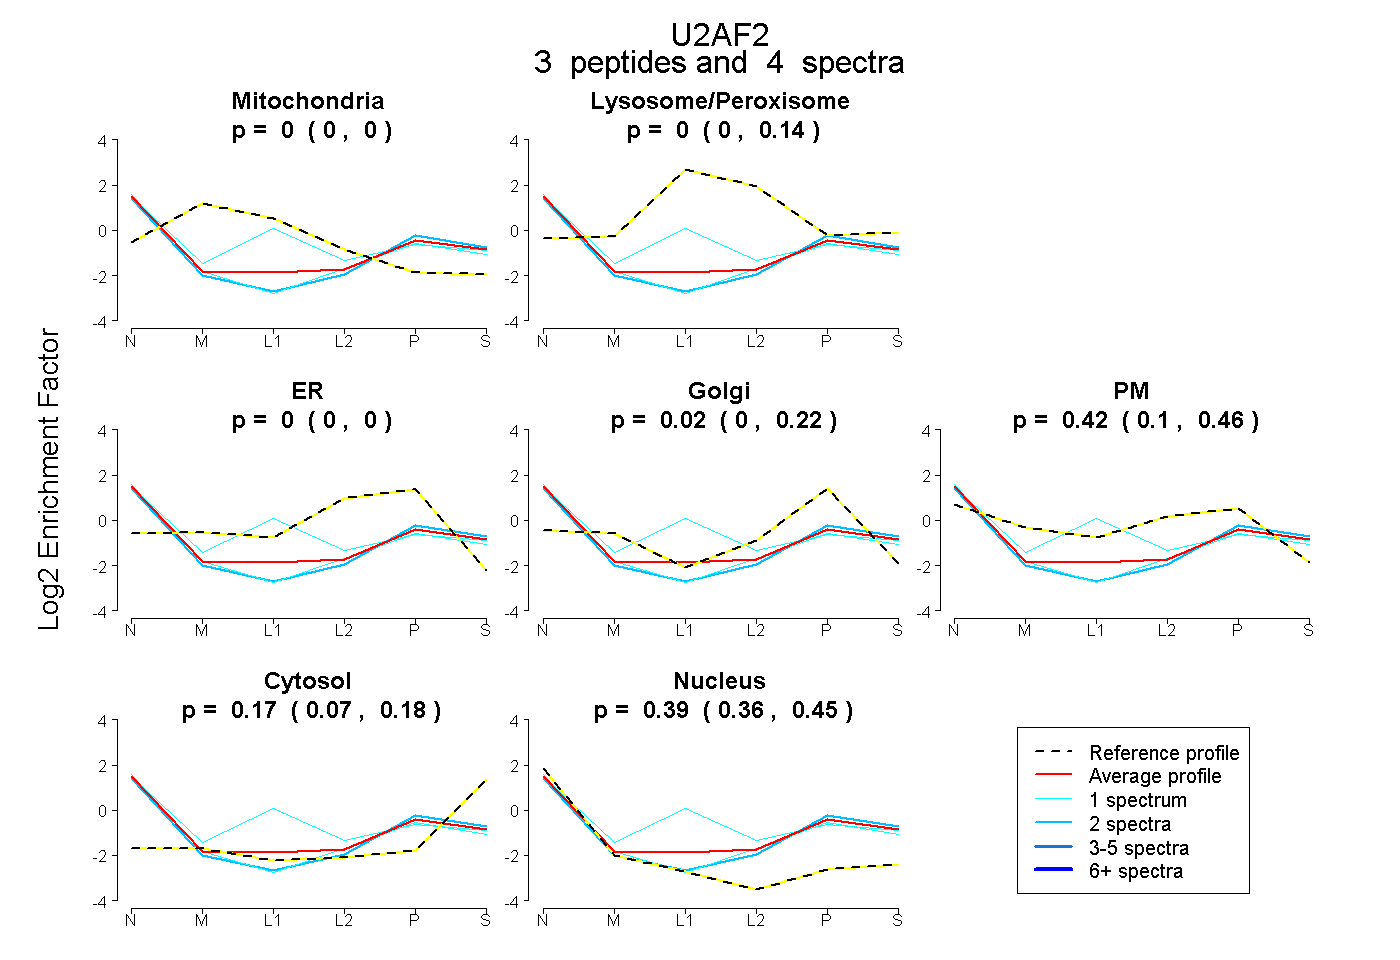 |
0.000 0.000 | 0.000 |
0.000 0.000 | 0.143 |
0.000 0.000 | 0.000 |
0.019 0.000 | 0.216 |
0.422 0.102 | 0.462 |
0.168 0.066 | 0.183 |
0.390 0.361 | 0.451 |
|||
| Plot | Lyso | Other | |||||||||||
| Expt C |
4 peptides |
7 spectra |
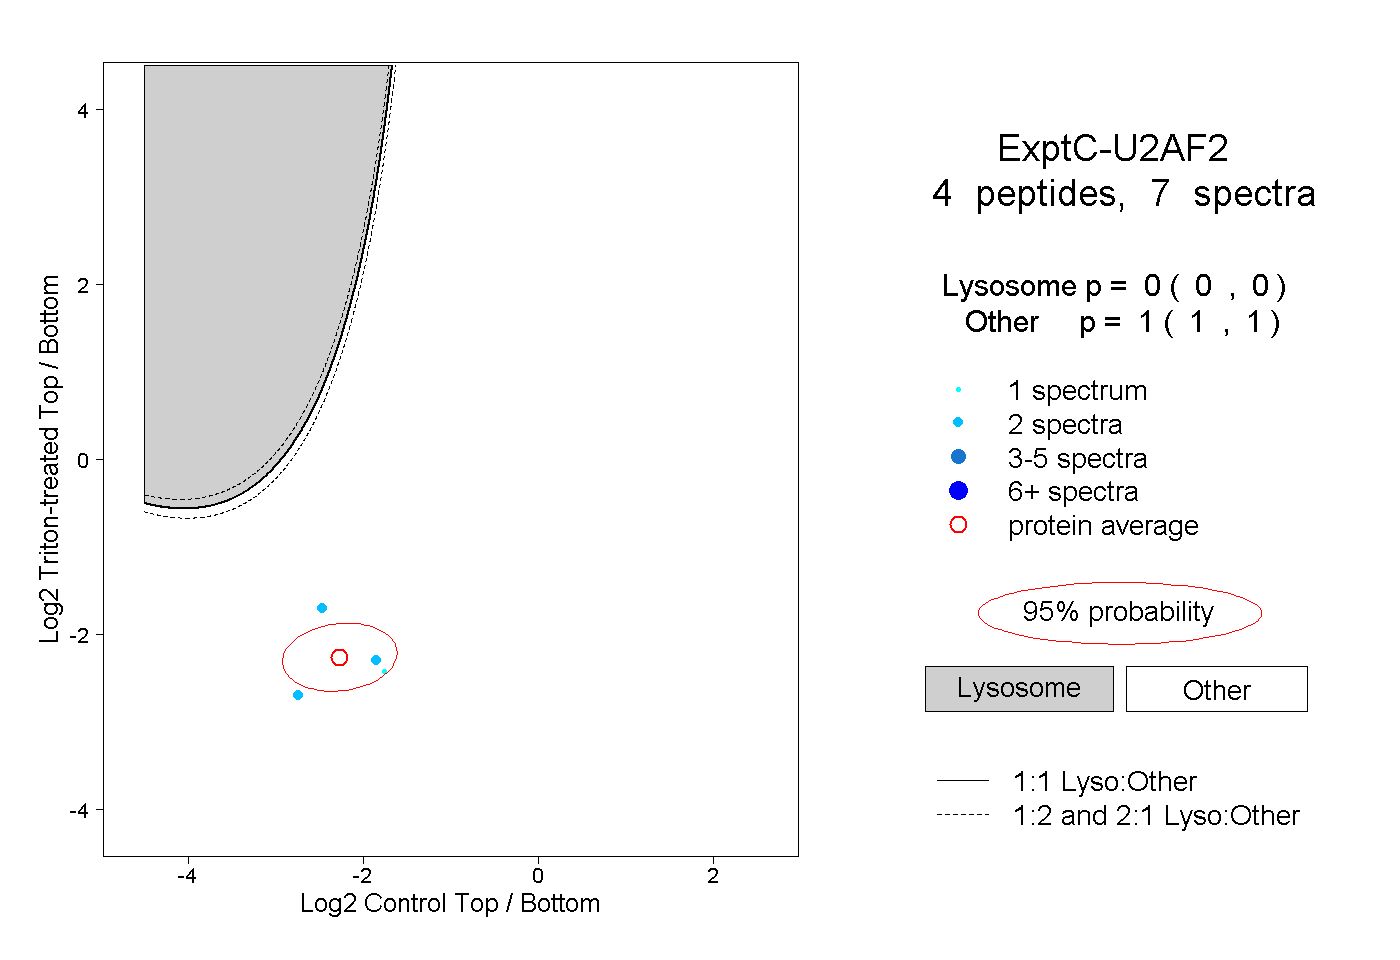 |
0.000 0.000 | 0.000 |
1.000 1.000 | 1.000 |