 12
12peptides
spectra
0.000 | 0.000
0.000 | 0.000
0.000 | 0.024
0.172 | 0.249
0.000 | 0.045
0.495 | 0.562
0.217 | 0.244
0.000 | 0.000
8peptides
spectra
0.000 | 0.000
1.000 | 1.000
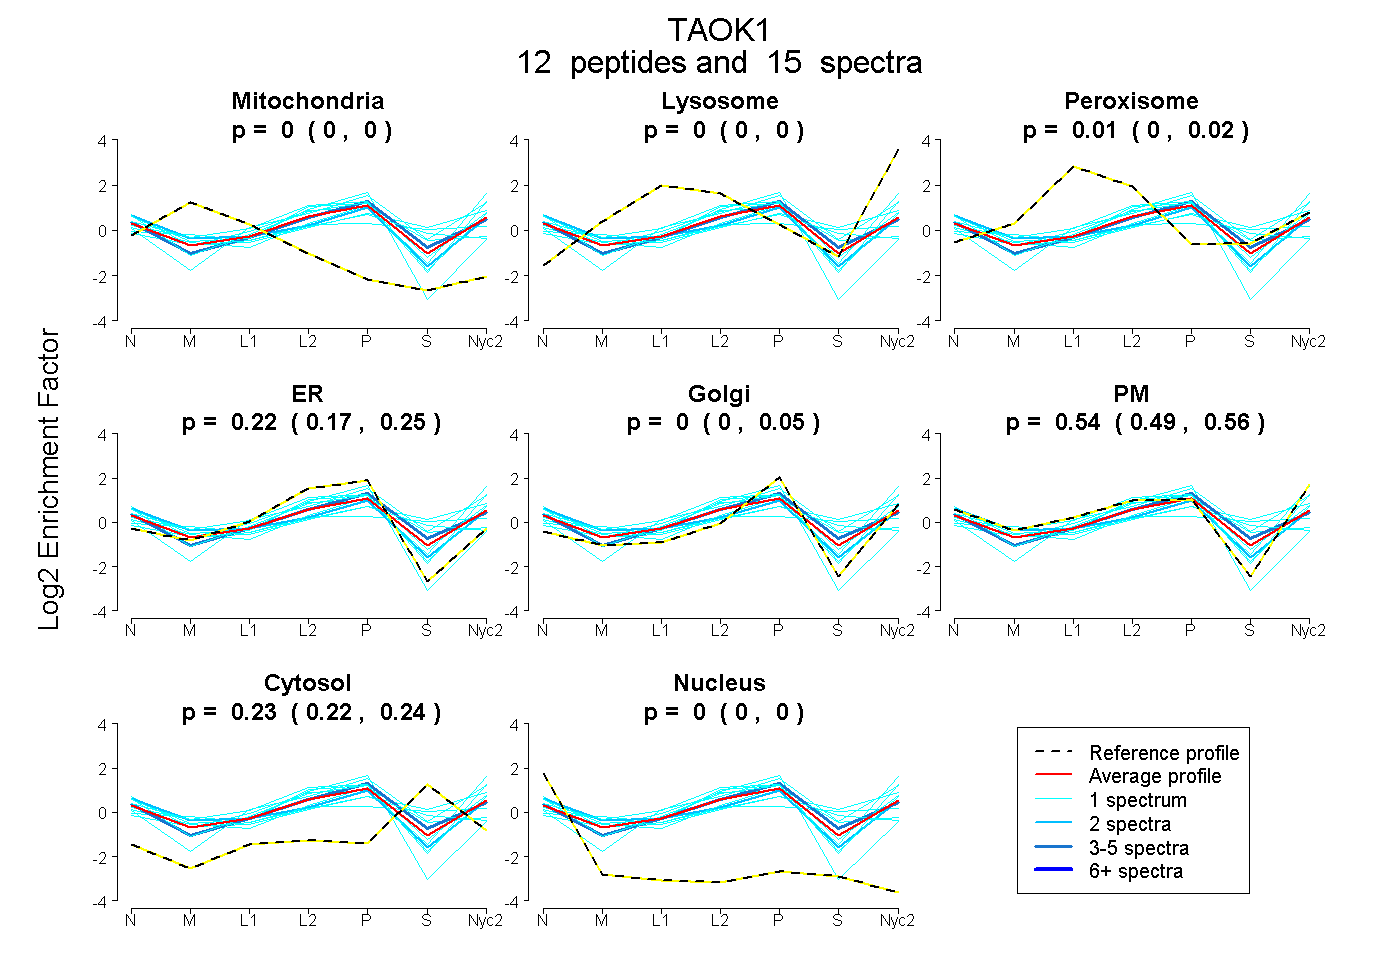
| Plot | Mito | Lyso | Perox | ER | Golgi | PM | Cytosol | Nucleus | |||||
| Expt A |
12 peptides |
15 spectra |
|
0.000 0.000 | 0.000 |
0.000 0.000 | 0.000 |
0.006 0.000 | 0.024 |
0.219 0.172 | 0.249 |
0.002 0.000 | 0.045 |
0.538 0.495 | 0.562 |
0.234 0.217 | 0.244 |
0.000 0.000 | 0.000 |
||
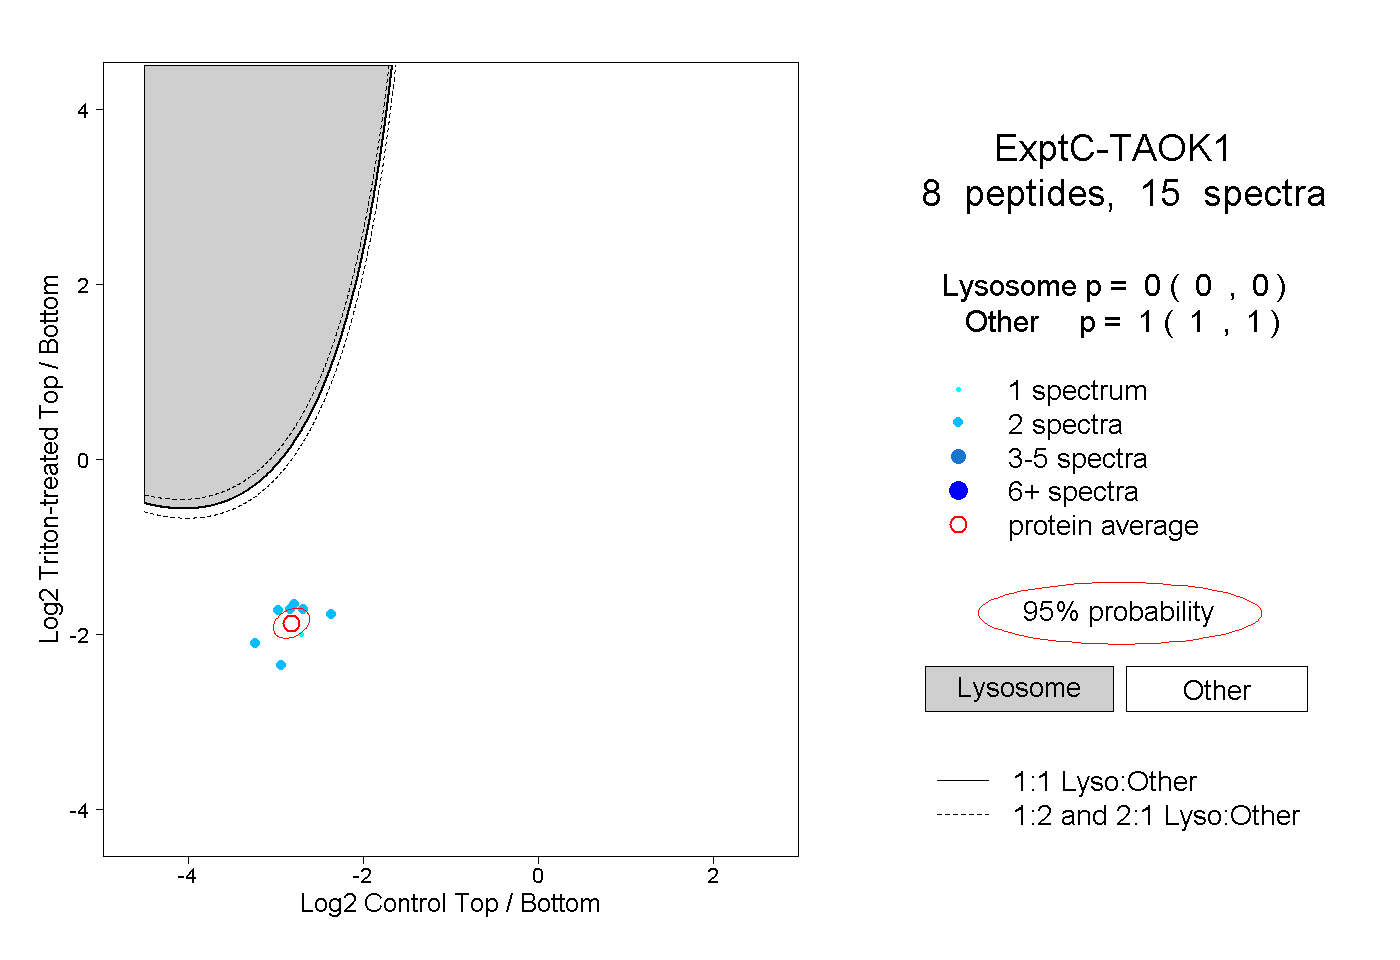
| Plot | Lyso | Other | |||||||||||
| Expt C |
8 peptides |
15 spectra |
|
0.000 0.000 | 0.000 |
1.000 1.000 | 1.000 |
| 2 spectra, EIEAFDSESMR | 0.000 | 1.000 | ||||||||
| 1 spectrum, ERPETVLIDLIQR | 0.000 | 1.000 | ||||||||
| 2 spectra, LFTDLR | 0.000 | 1.000 | ||||||||
| 2 spectra, DLEHAMLLR | 0.000 | 1.000 | ||||||||
| 2 spectra, HNLEQDLVR | 0.000 | 1.000 | ||||||||
| 2 spectra, VMANEEK | 0.000 | 1.000 | ||||||||
| 2 spectra, ASDPQSPPQVSR | 0.000 | 1.000 | ||||||||
| 2 spectra, QYLELECR | 0.000 | 1.000 |