 12
12peptides
spectra
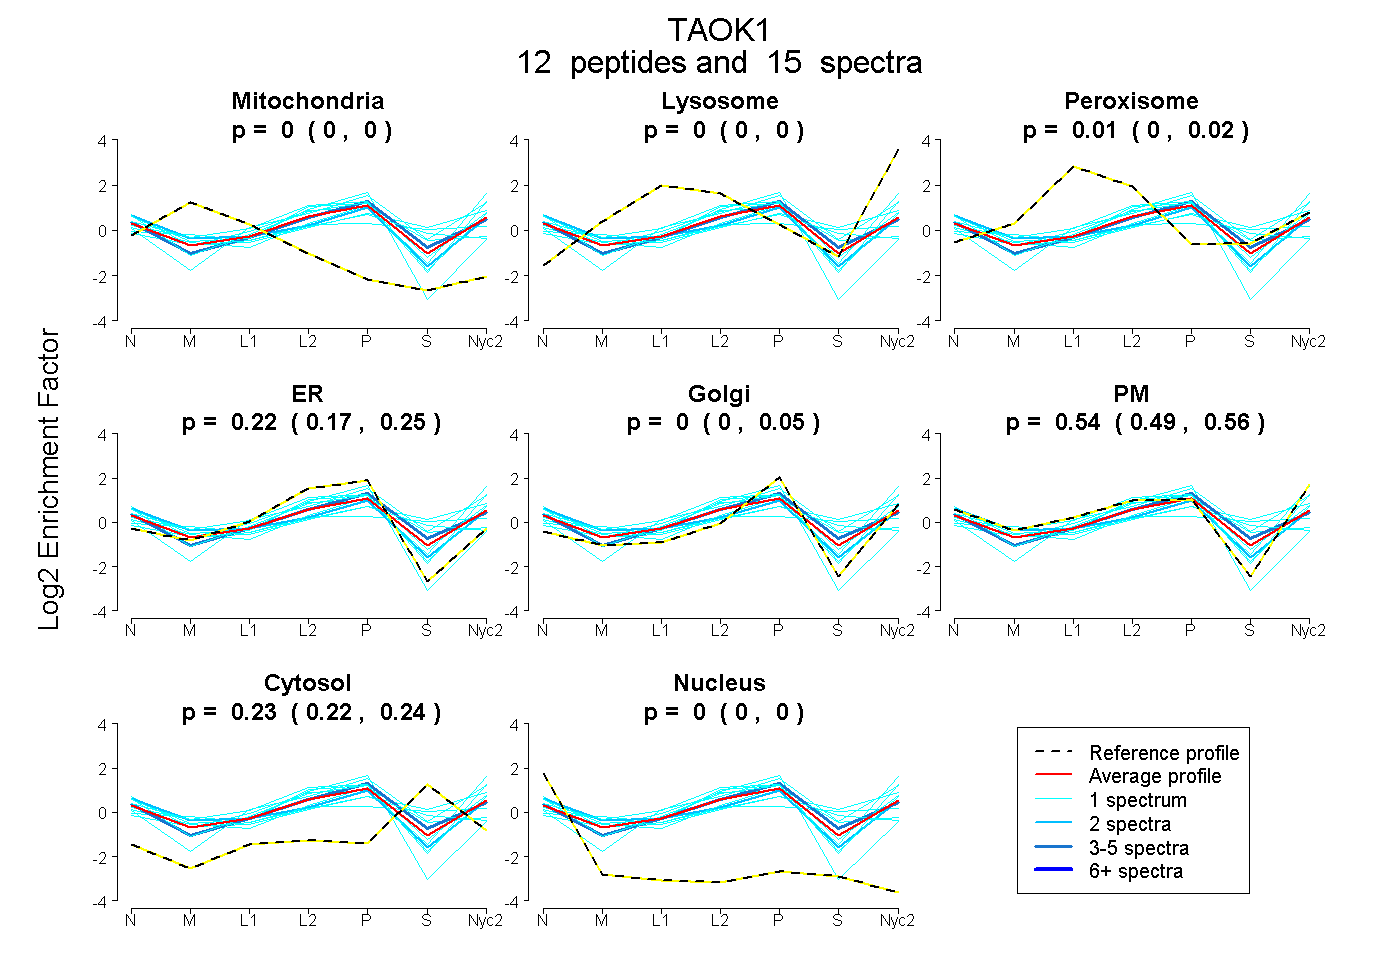
0.000 | 0.000
0.000 | 0.000
0.000 | 0.024
0.172 | 0.249
0.000 | 0.045
0.495 | 0.562
0.217 | 0.244
0.000 | 0.000
| Plot | Mito | Lyso | Perox | ER | Golgi | PM | Cytosol | Nucleus | |||||
| Expt A |
12 peptides |
15 spectra |
|
0.000 0.000 | 0.000 |
0.000 0.000 | 0.000 |
0.006 0.000 | 0.024 |
0.219 0.172 | 0.249 |
0.002 0.000 | 0.045 |
0.538 0.495 | 0.562 |
0.234 0.217 | 0.244 |
0.000 0.000 | 0.000 |
| 3 spectra, HMFVLR | 0.000 | 0.000 | 0.000 | 0.253 | 0.033 | 0.449 | 0.265 | 0.000 | ||
| 1 spectrum, QMQEHEQDSELR | 0.000 | 0.135 | 0.000 | 0.122 | 0.165 | 0.332 | 0.247 | 0.000 | ||
| 1 spectrum, EIEAFDSESMR | 0.000 | 0.006 | 0.000 | 0.000 | 0.000 | 0.875 | 0.119 | 0.000 | ||
| 1 spectrum, IEEEMLALQNER | 0.000 | 0.000 | 0.066 | 0.314 | 0.000 | 0.552 | 0.068 | 0.000 | ||
| 2 spectra, ERPETVLIDLIQR | 0.062 | 0.000 | 0.000 | 0.052 | 0.143 | 0.595 | 0.116 | 0.032 | ||
| 1 spectrum, LFTDLR | 0.000 | 0.000 | 0.000 | 0.207 | 0.000 | 0.604 | 0.189 | 0.000 | ||
| 1 spectrum, DLEHAMLLR | 0.077 | 0.000 | 0.000 | 0.731 | 0.092 | 0.062 | 0.000 | 0.038 | ||
| 1 spectrum, HNLEQDLVR | 0.000 | 0.000 | 0.000 | 0.097 | 0.045 | 0.782 | 0.076 | 0.000 | ||
| 1 spectrum, NFVDSCLQK | 0.021 | 0.000 | 0.062 | 0.284 | 0.000 | 0.237 | 0.395 | 0.000 | ||
| 1 spectrum, ASDPQSPPQVSR | 0.000 | 0.120 | 0.016 | 0.000 | 0.115 | 0.360 | 0.390 | 0.000 | ||
| 1 spectrum, ENIQHFQAEEEANLLR | 0.035 | 0.000 | 0.178 | 0.010 | 0.081 | 0.323 | 0.373 | 0.000 | ||
| 1 spectrum, HLNTIQK | 0.002 | 0.000 | 0.000 | 0.375 | 0.059 | 0.221 | 0.343 | 0.000 |
| Plot | Lyso | Other | |||||||||||
| Expt C |
8 peptides |
15 spectra |
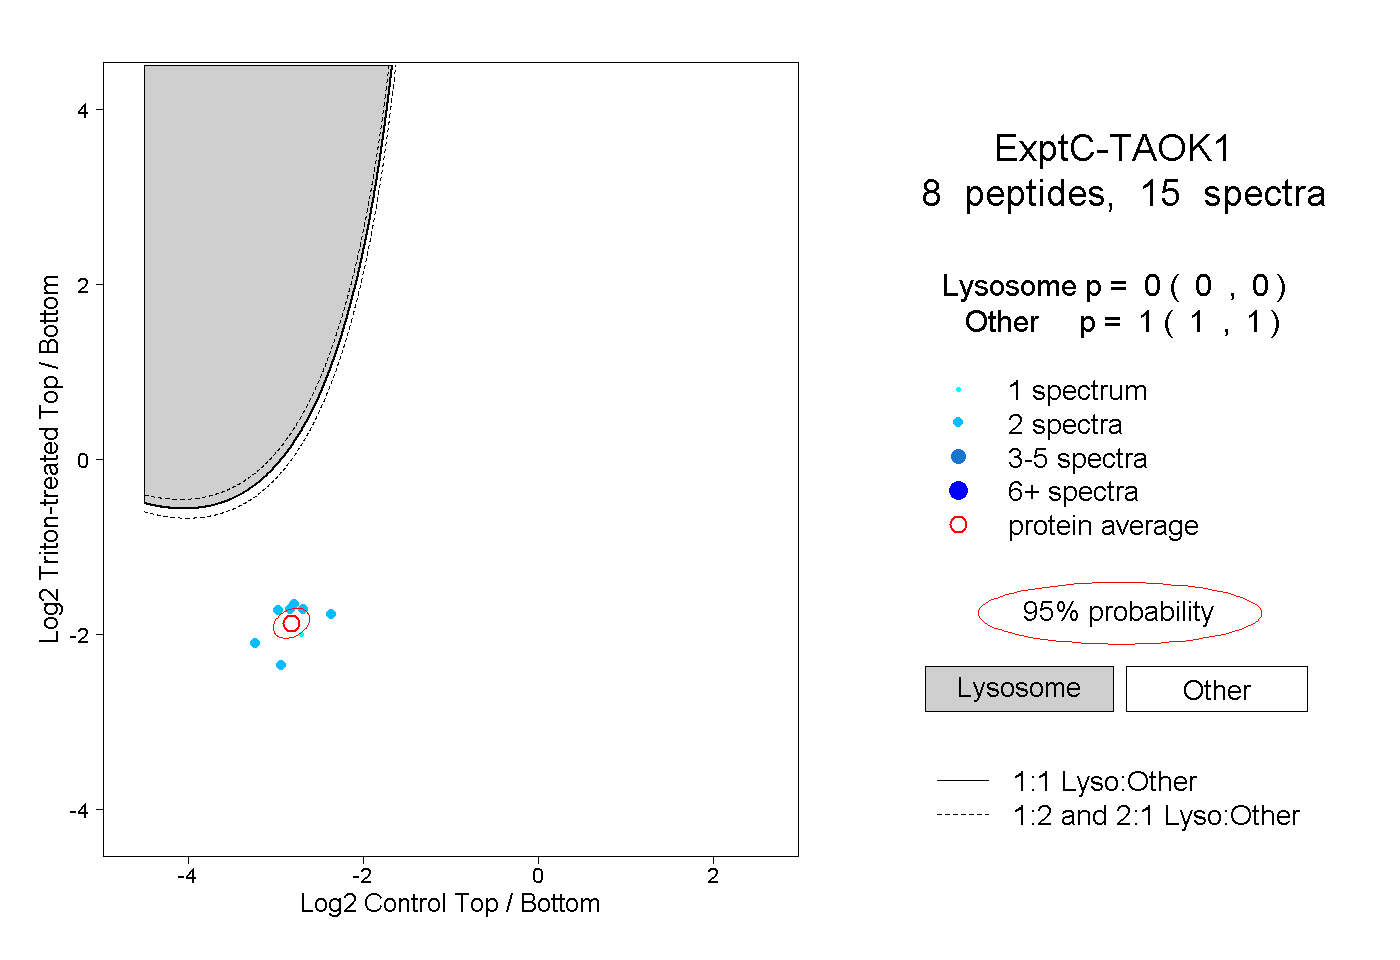 |
0.000 0.000 | 0.000 |
1.000 1.000 | 1.000 |