 11
11peptides
spectra
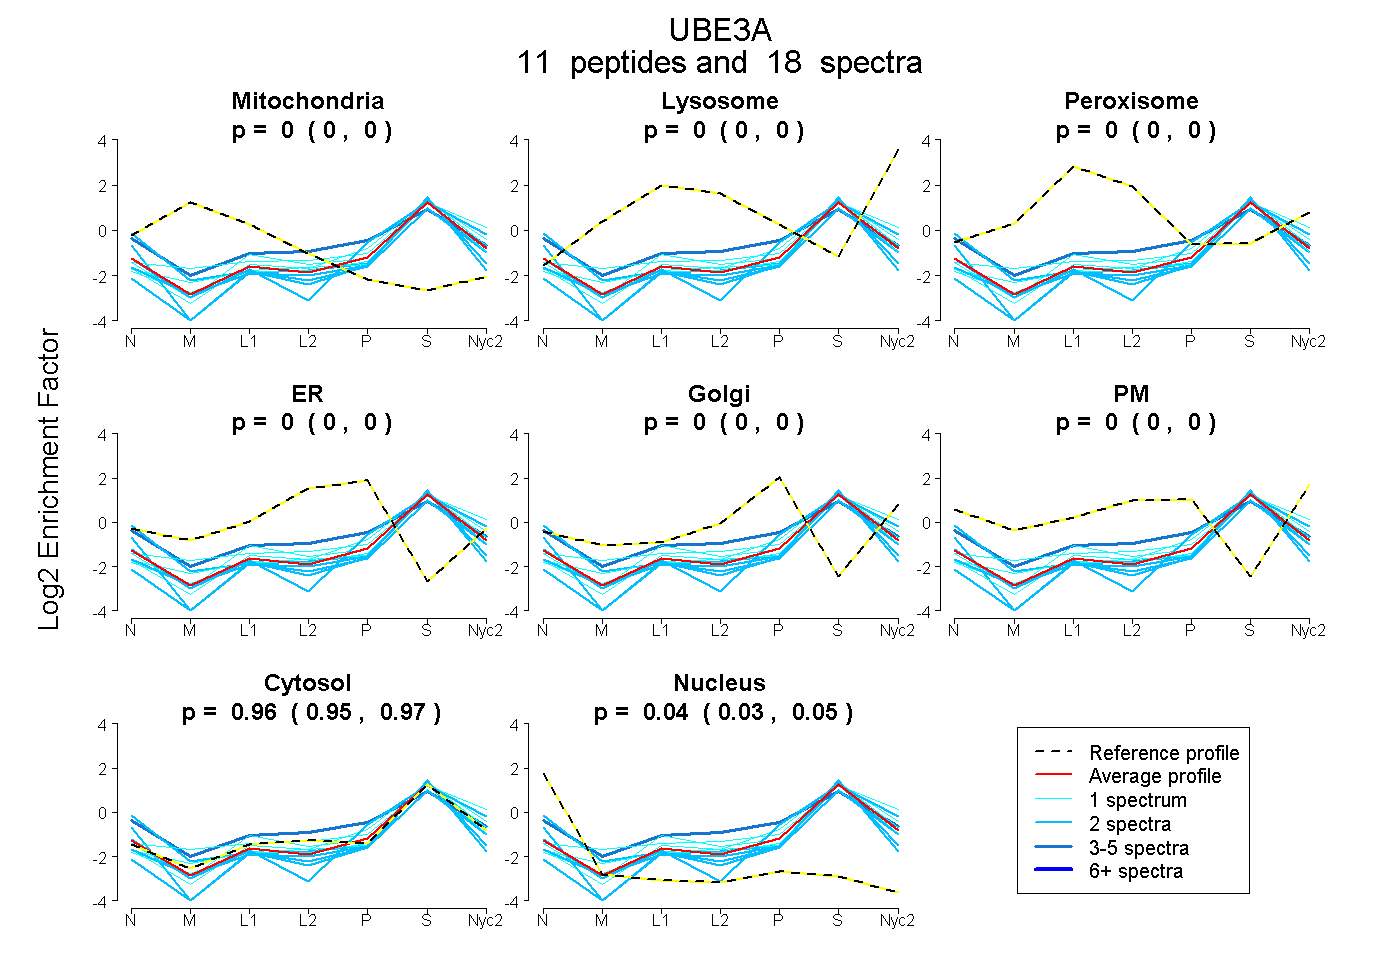
0.000 | 0.000
0.000 | 0.000
0.000 | 0.000
0.000 | 0.000
0.000 | 0.000
0.000 | 0.000
0.948 | 0.967
0.031 | 0.050
3peptides
spectra
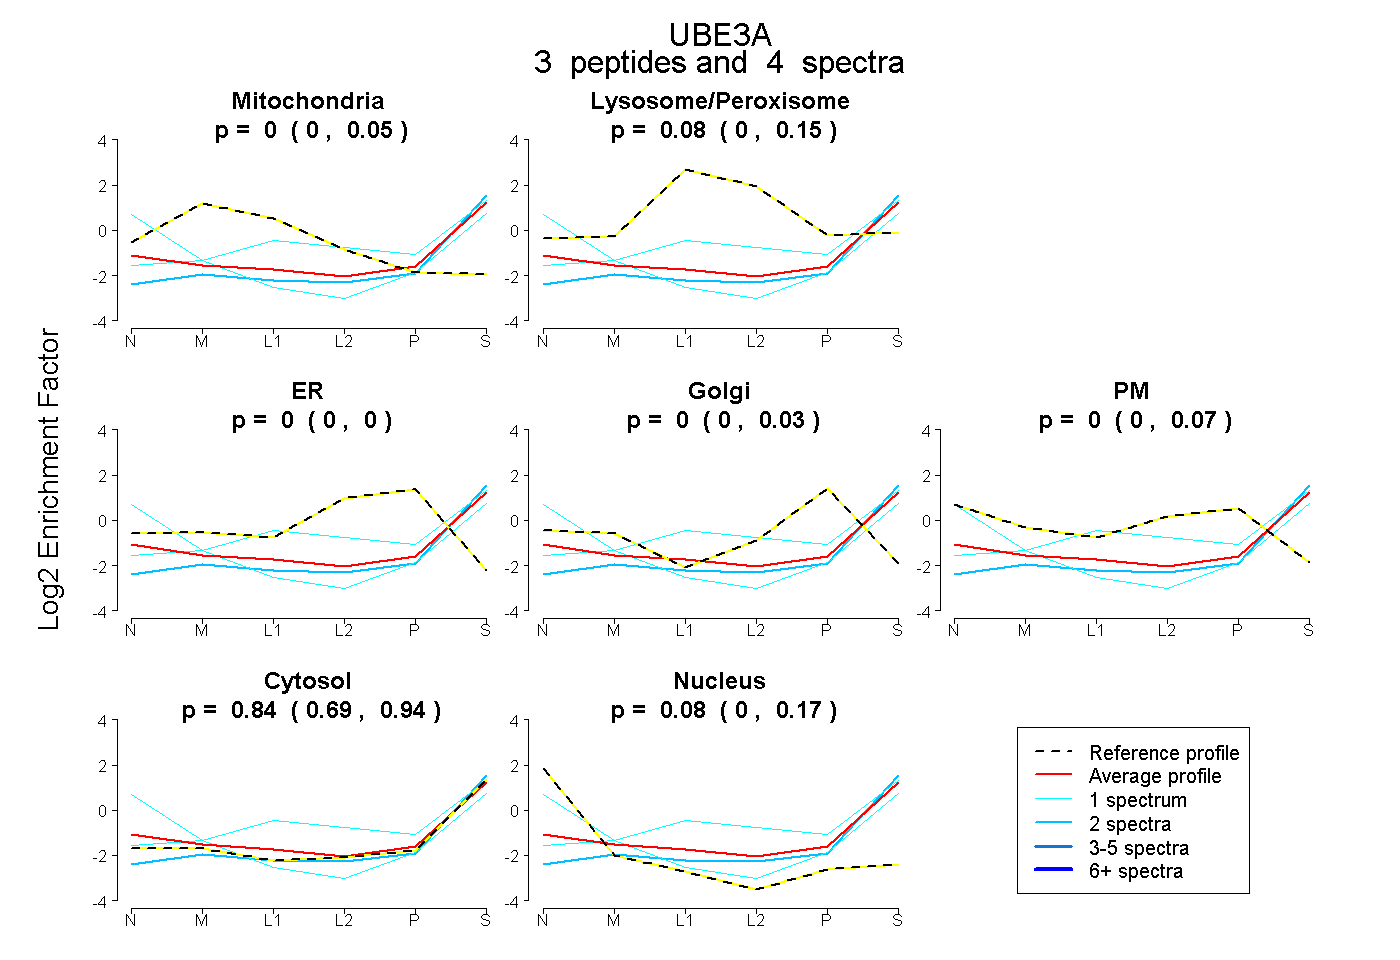
0.000 | 0.046
0.000 | 0.154
0.000 | 0.000
0.000 | 0.027
0.000 | 0.069
0.693 | 0.938
0.000 | 0.174
7peptides
spectra
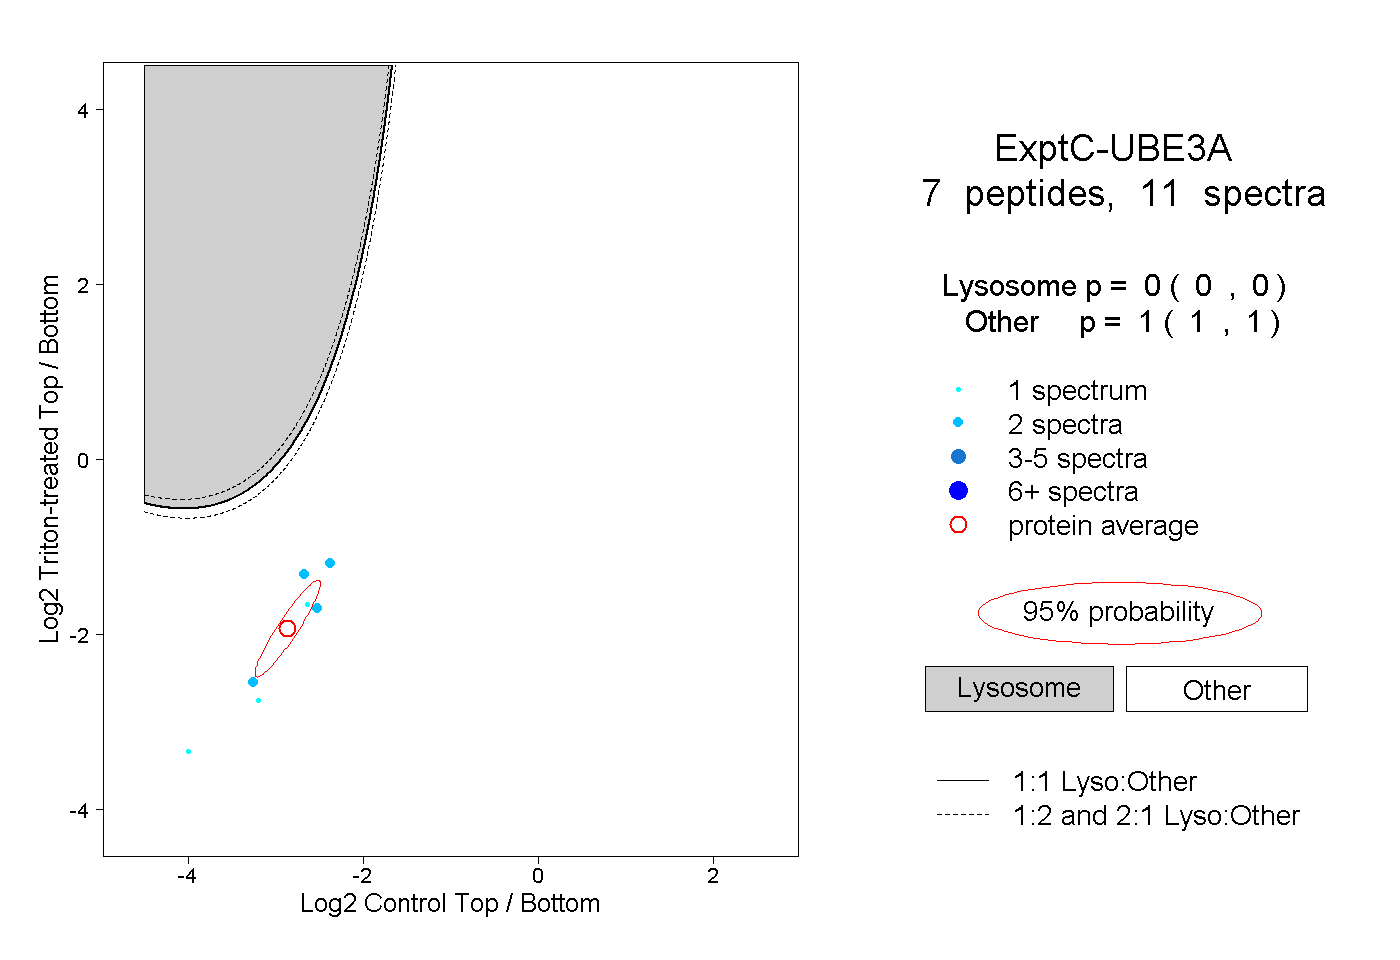
0.000 | 0.000
1.000 | 1.000