16
16peptides
spectra
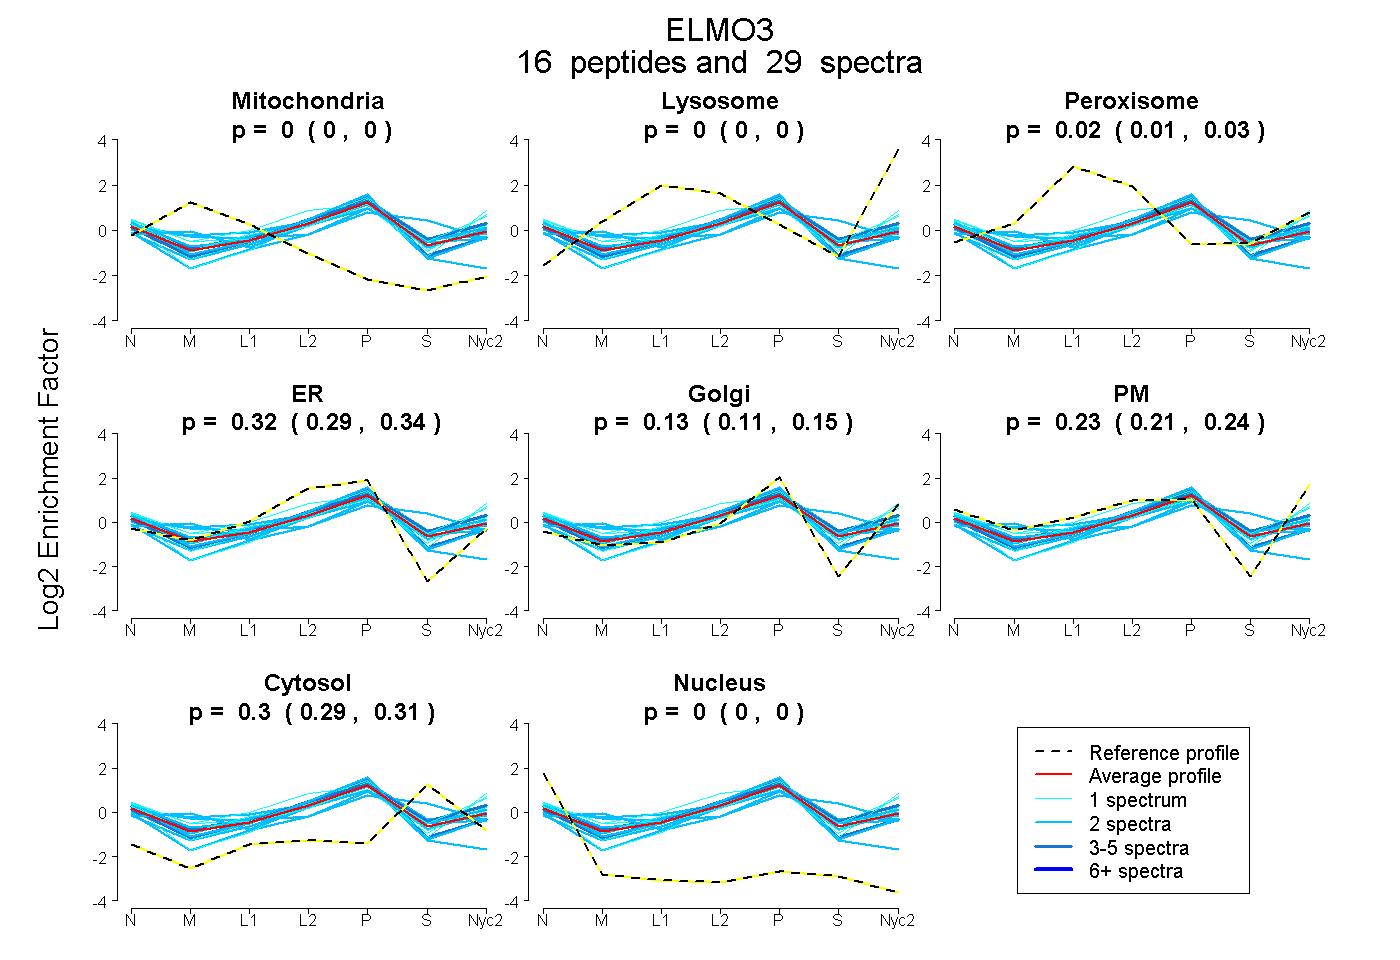
0.000 | 0.000
0.000 | 0.000
0.011 | 0.033
0.294 | 0.341
0.105 | 0.151
0.206 | 0.245
0.292 | 0.308
0.000 | 0.000
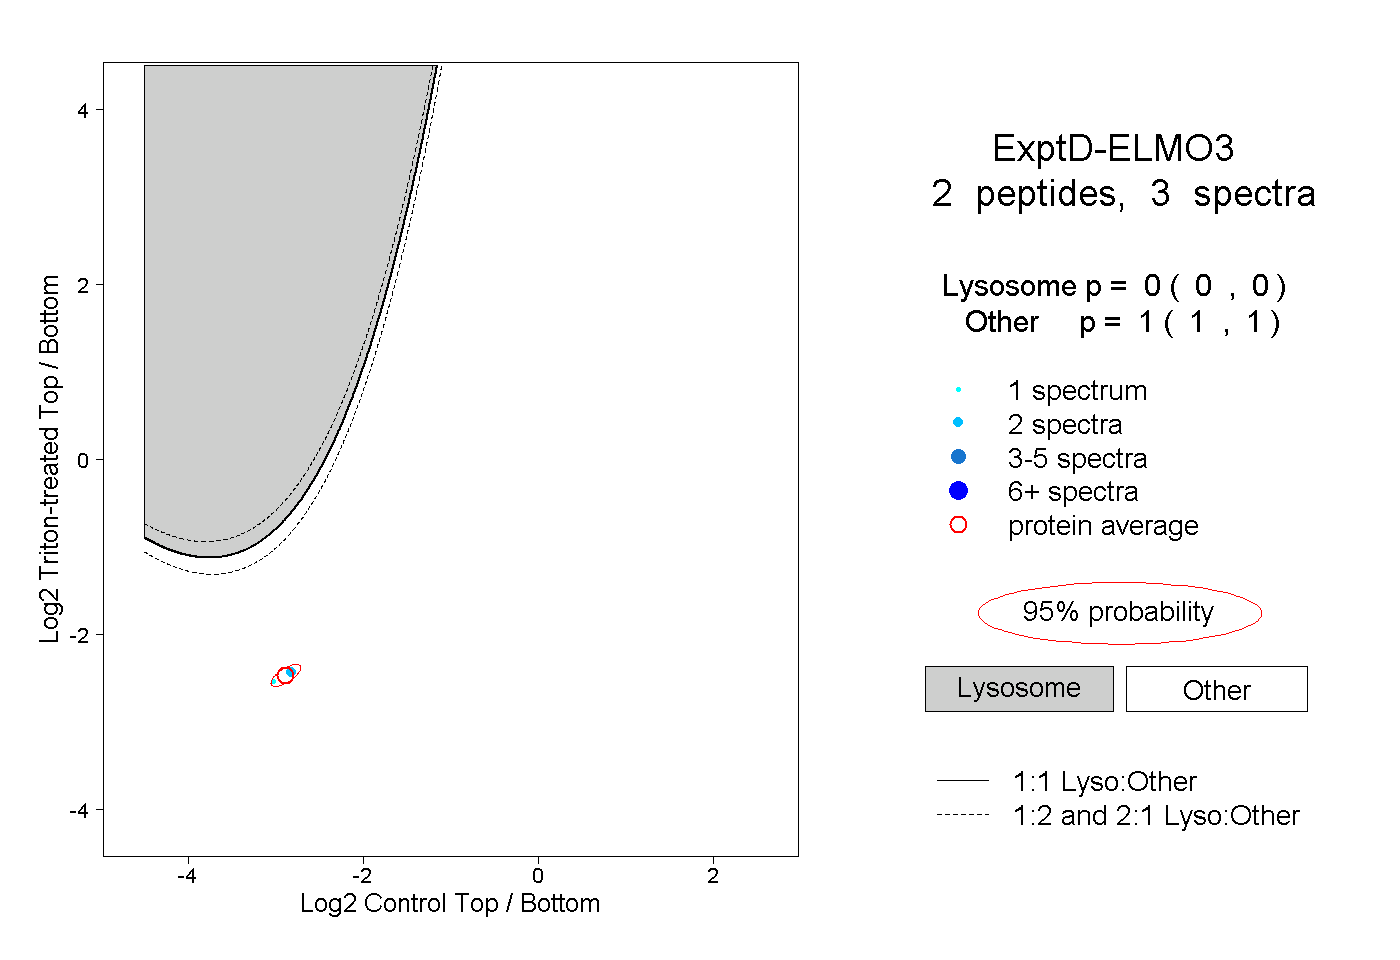
2peptides
spectra
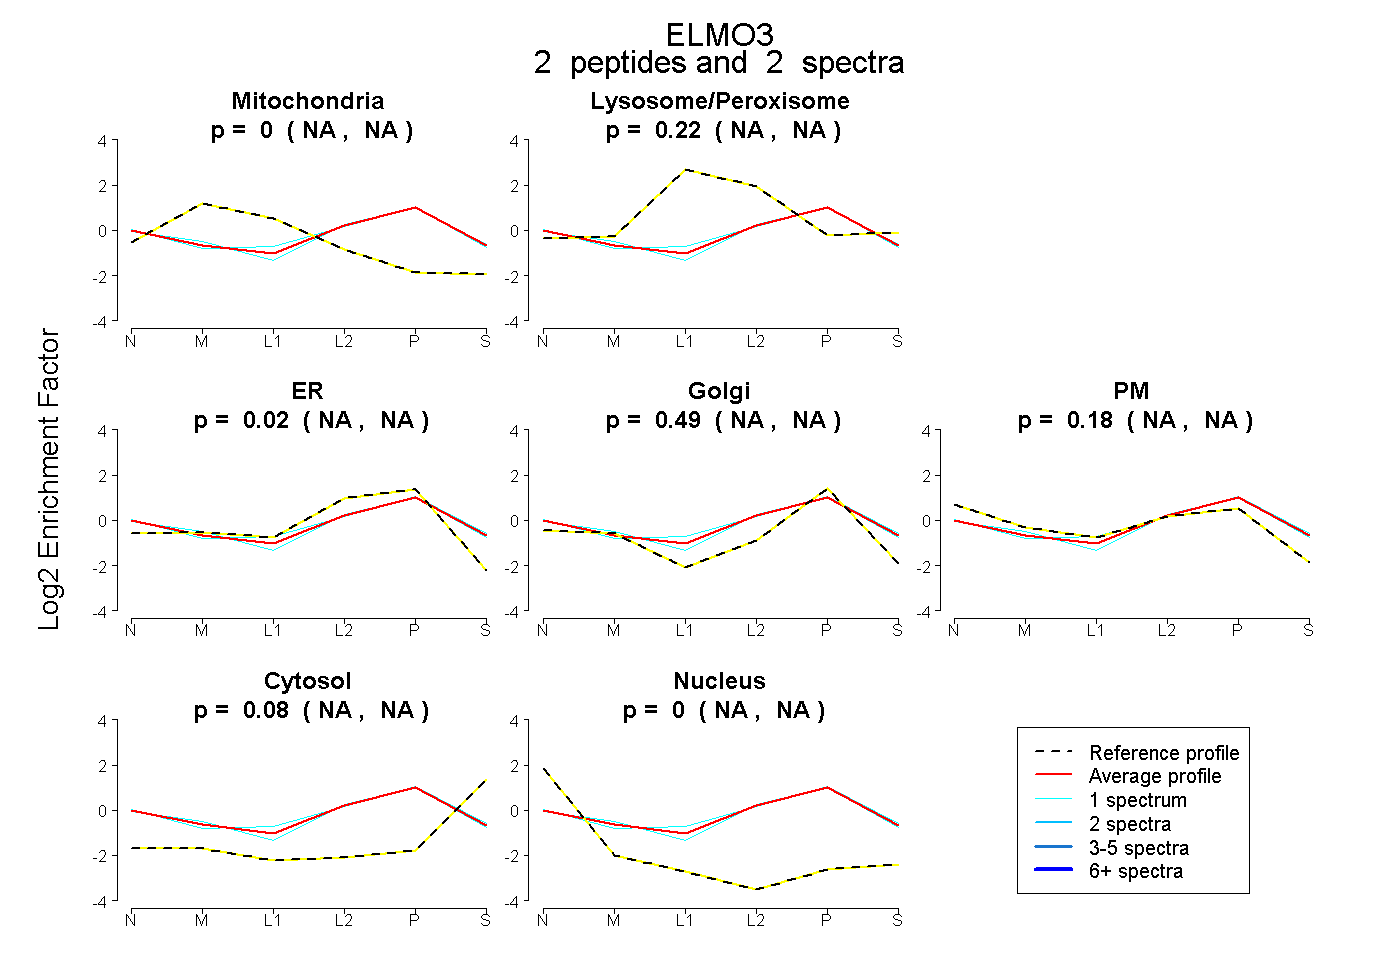
NA | NA
NA | NA
NA | NA
NA | NA
NA | NA
NA | NA
NA | NA
12peptides
spectra
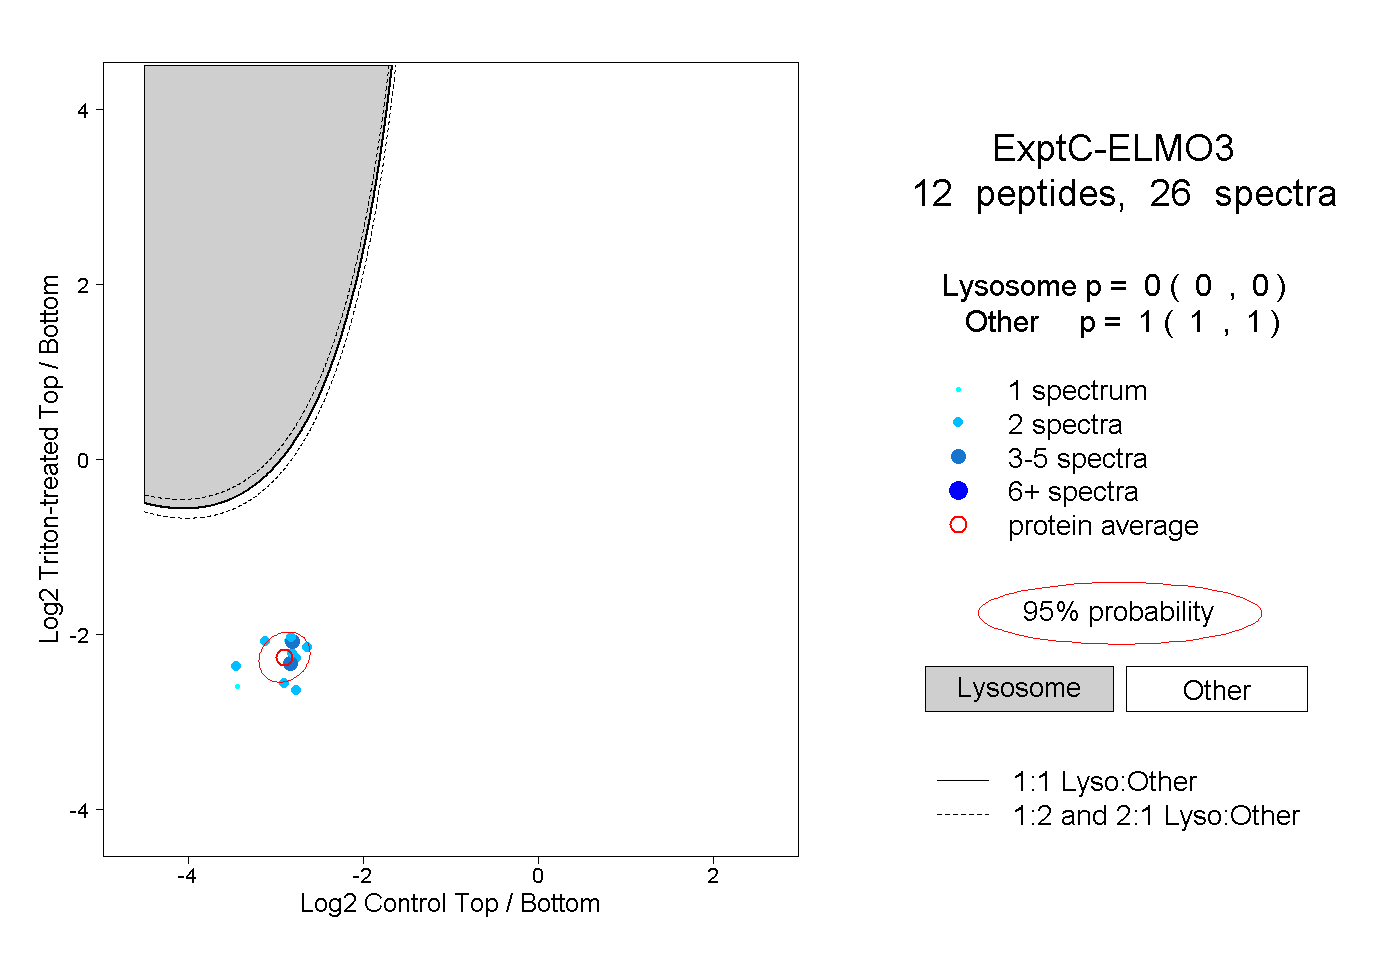
0.000 | 0.000
1.000 | 1.000