 16
16peptides
spectra
0.000 | 0.000
0.000 | 0.000
0.011 | 0.033
0.294 | 0.341
0.105 | 0.151
0.206 | 0.245
0.292 | 0.308
0.000 | 0.000
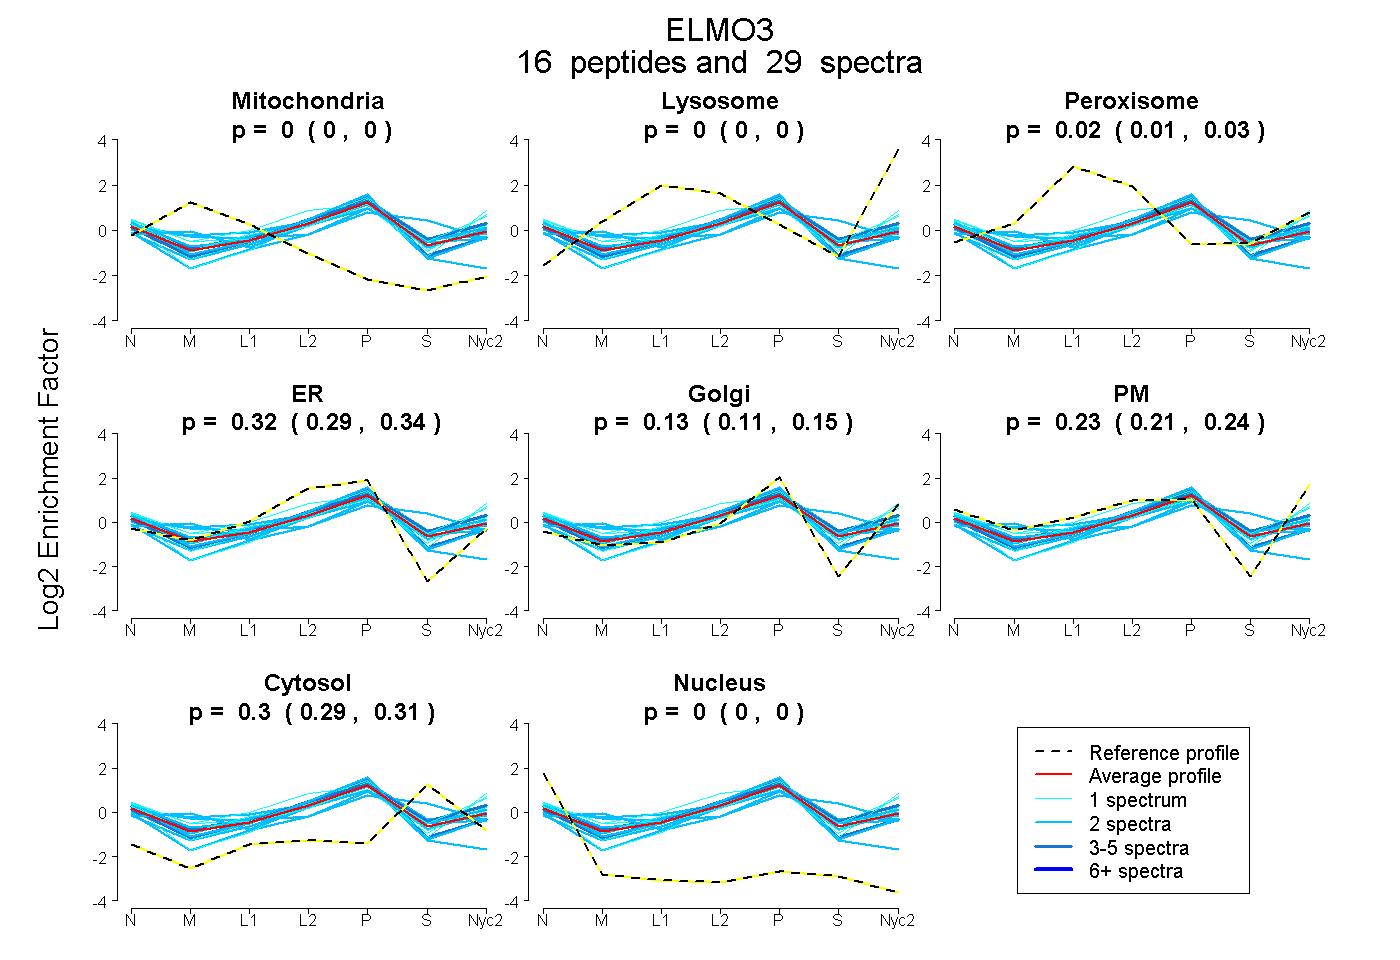
| Plot | Mito | Lyso | Perox | ER | Golgi | PM | Cytosol | Nucleus | |||||
| Expt A |
16 peptides |
29 spectra |
|
0.000 0.000 | 0.000 |
0.000 0.000 | 0.000 |
0.023 0.011 | 0.033 |
0.320 0.294 | 0.341 |
0.129 0.105 | 0.151 |
0.227 0.206 | 0.245 |
0.301 0.292 | 0.308 |
0.000 0.000 | 0.000 |
| 2 spectra, EQLQALR | 0.000 | 0.000 | 0.000 | 0.246 | 0.107 | 0.099 | 0.547 | 0.000 | ||
| 1 spectrum, LGFSNSSPAQDLER | 0.000 | 0.000 | 0.052 | 0.209 | 0.182 | 0.311 | 0.246 | 0.000 | ||
| 2 spectra, FVLENSSR | 0.000 | 0.000 | 0.000 | 0.297 | 0.059 | 0.349 | 0.295 | 0.000 | ||
| 3 spectra, AQQLLSR | 0.000 | 0.000 | 0.072 | 0.414 | 0.255 | 0.045 | 0.183 | 0.032 | ||
| 1 spectrum, LHQEGTLAPPILELR | 0.000 | 0.000 | 0.071 | 0.159 | 0.003 | 0.608 | 0.159 | 0.000 | ||
| 2 spectra, SEVPLDR | 0.000 | 0.000 | 0.000 | 0.514 | 0.159 | 0.103 | 0.200 | 0.024 | ||
| 2 spectra, EGCCEVLR | 0.111 | 0.000 | 0.142 | 0.097 | 0.409 | 0.000 | 0.241 | 0.000 | ||
| 2 spectra, VMQVVR | 0.052 | 0.000 | 0.152 | 0.036 | 0.440 | 0.083 | 0.236 | 0.000 | ||
| 2 spectra, ALLMGK | 0.000 | 0.000 | 0.036 | 0.332 | 0.274 | 0.015 | 0.343 | 0.000 | ||
| 1 spectrum, DCPHVR | 0.000 | 0.000 | 0.000 | 0.353 | 0.132 | 0.234 | 0.281 | 0.000 | ||
| 1 spectrum, LDLEQLLTMETK | 0.000 | 0.000 | 0.000 | 0.213 | 0.257 | 0.190 | 0.341 | 0.000 | ||
| 1 spectrum, TPLDPYSQEQR | 0.000 | 0.000 | 0.005 | 0.040 | 0.097 | 0.615 | 0.242 | 0.000 | ||
| 1 spectrum, VNALTYGEVLR | 0.000 | 0.000 | 0.059 | 0.000 | 0.282 | 0.385 | 0.274 | 0.000 | ||
| 2 spectra, DMLDCLWK | 0.000 | 0.000 | 0.092 | 0.404 | 0.131 | 0.062 | 0.311 | 0.000 | ||
| 4 spectra, LKPELMGLIR | 0.000 | 0.000 | 0.011 | 0.260 | 0.091 | 0.320 | 0.319 | 0.000 | ||
| 2 spectra, LCEGMLFR | 0.190 | 0.000 | 0.000 | 0.638 | 0.000 | 0.000 | 0.149 | 0.023 |
| Plot | Mito | Lyso or Perox | ER | Golgi | PM | Cytosol | Nucleus | ||||||
| Expt B |
2 peptides |
2 spectra |
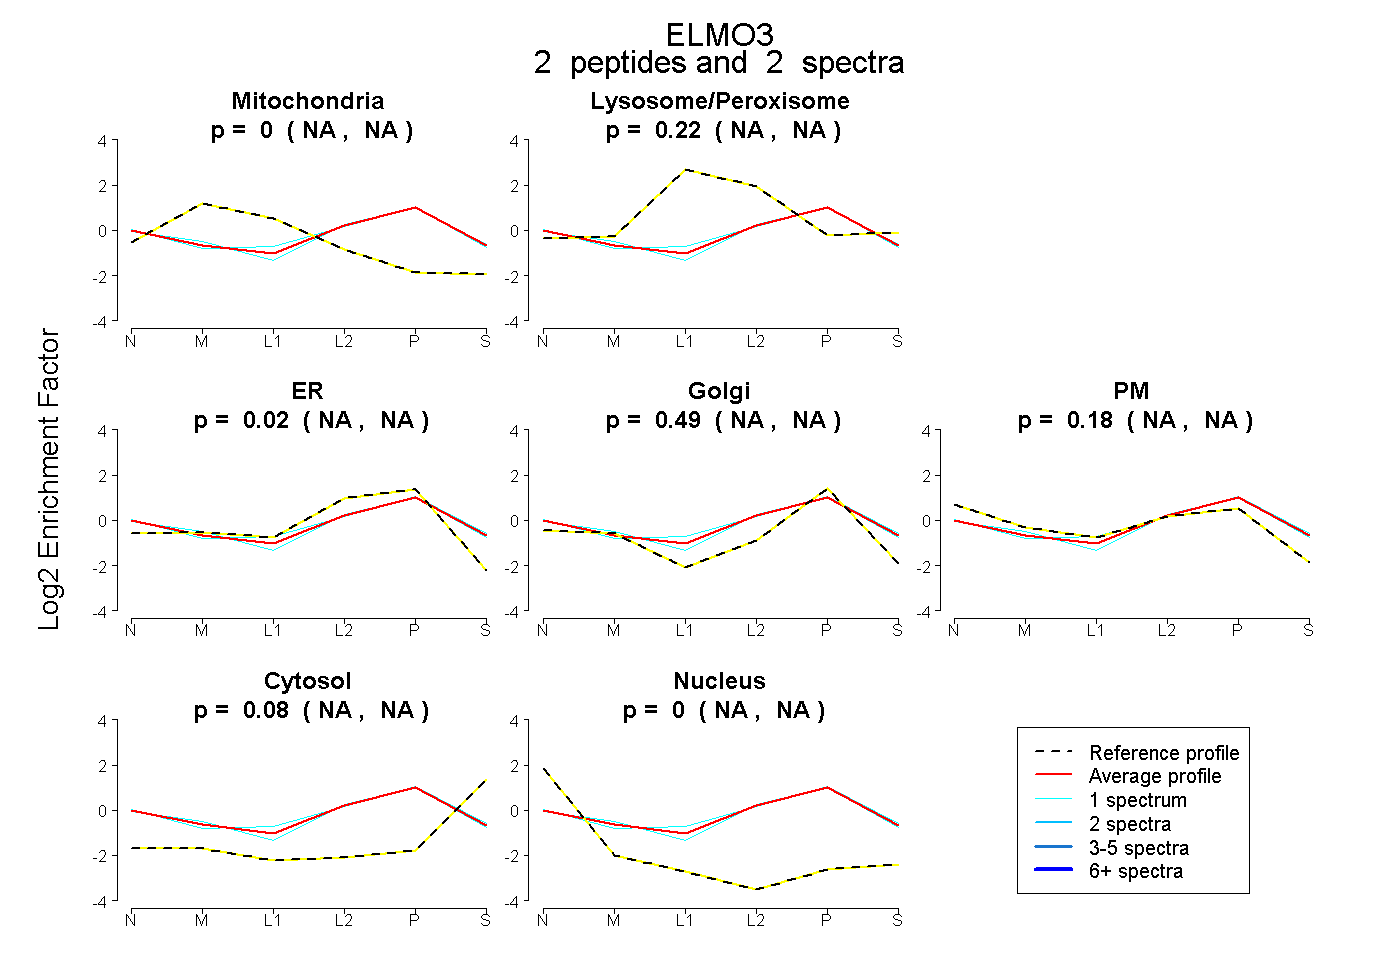 |
0.000 NA | NA |
0.222 NA | NA |
0.025 NA | NA |
0.489 NA | NA |
0.184 NA | NA |
0.080 NA | NA |
0.000 NA | NA |
|||
| Plot | Lyso | Other | |||||||||||
| Expt C |
12 peptides |
26 spectra |
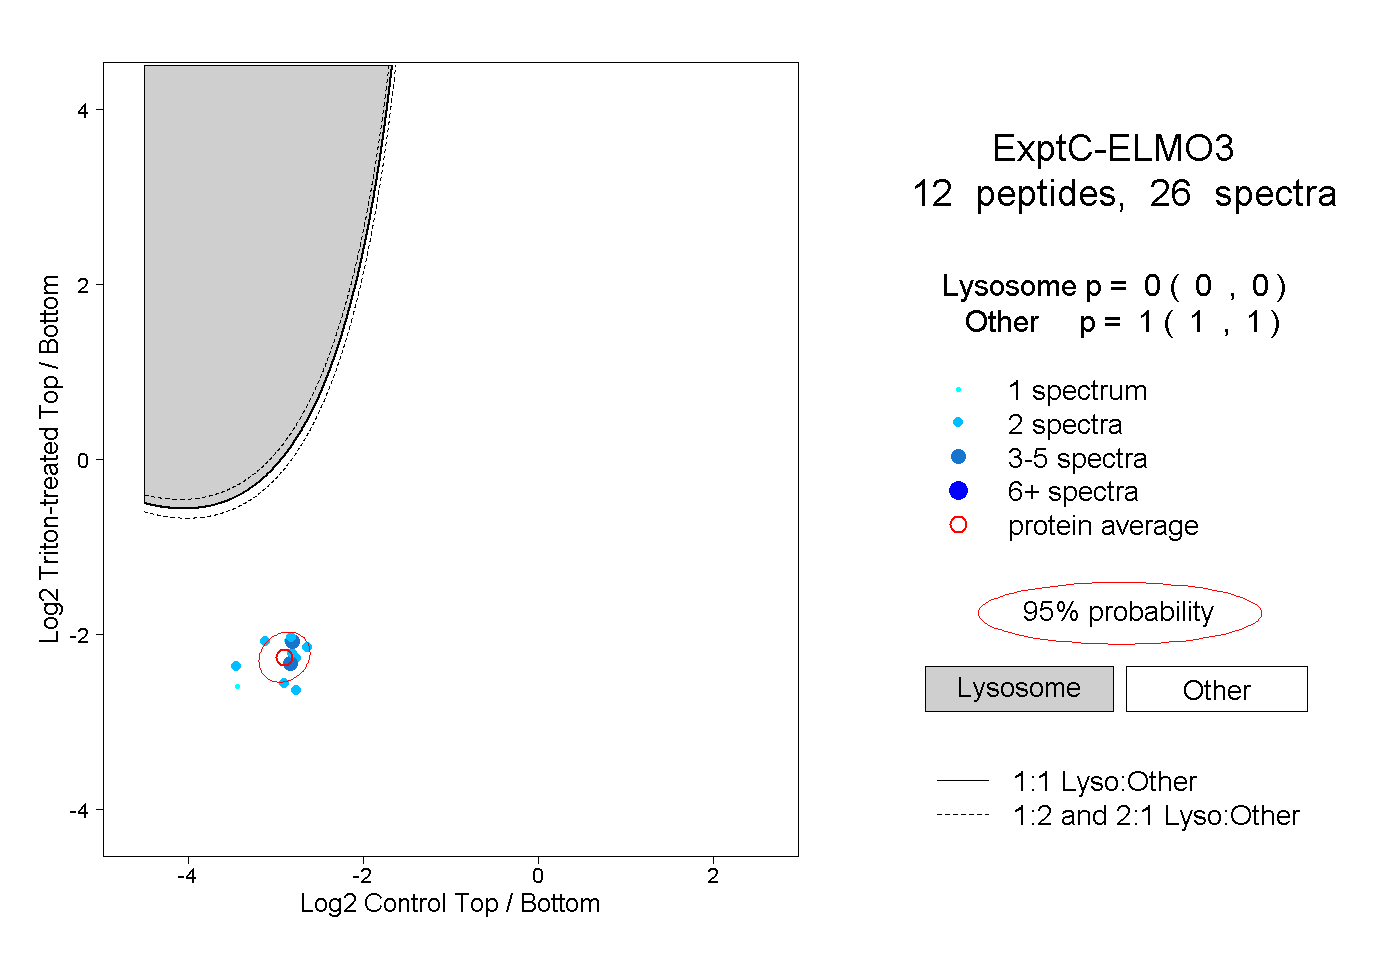 |
0.000 0.000 | 0.000 |
1.000 1.000 | 1.000 |
||||||||
| Plot | Lyso | Other | |||||||||||
| Expt D |
2 peptides |
3 spectra |
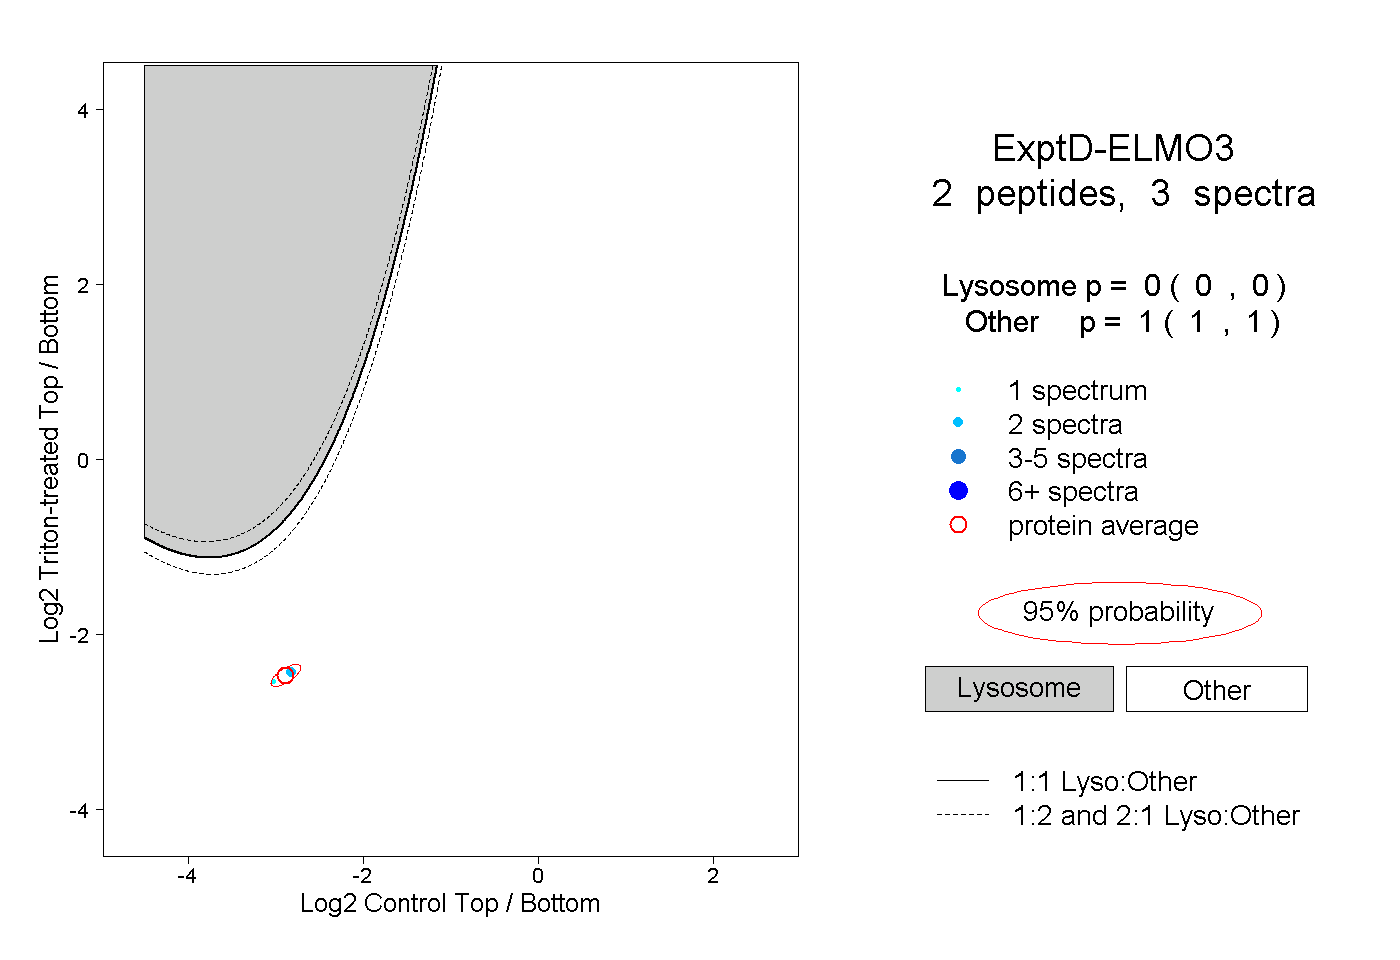 |
0.000 0.000 | 0.000 |
1.000 1.000 | 1.000 |