 3
3peptides
spectra
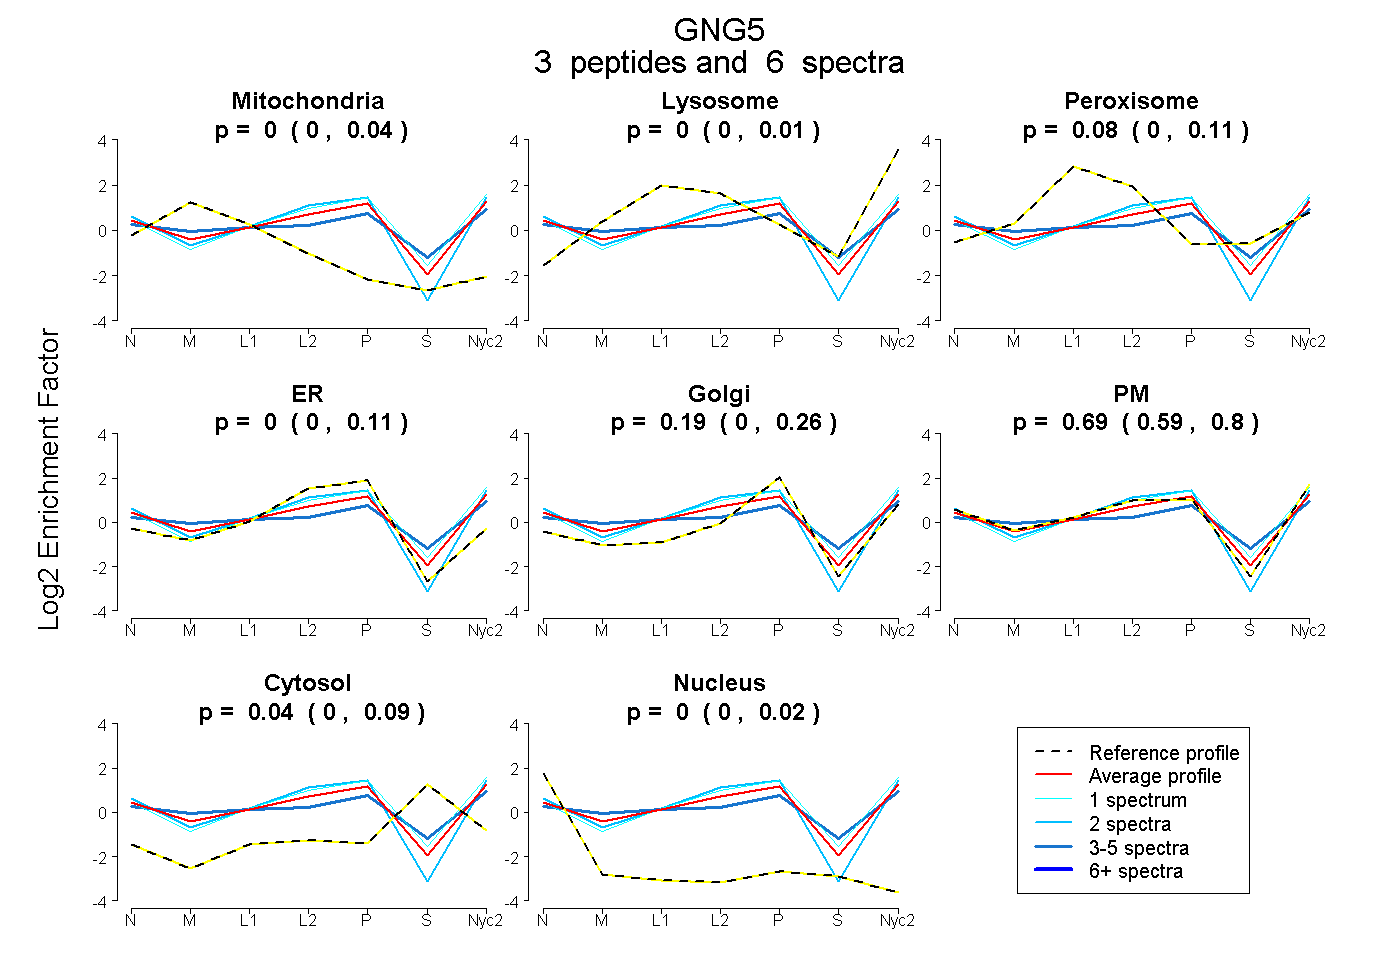
0.000 | 0.043
0.000 | 0.007
0.000 | 0.111
0.000 | 0.113
0.003 | 0.255
0.586 | 0.797
0.000 | 0.087
0.000 | 0.017
1peptide
spectra
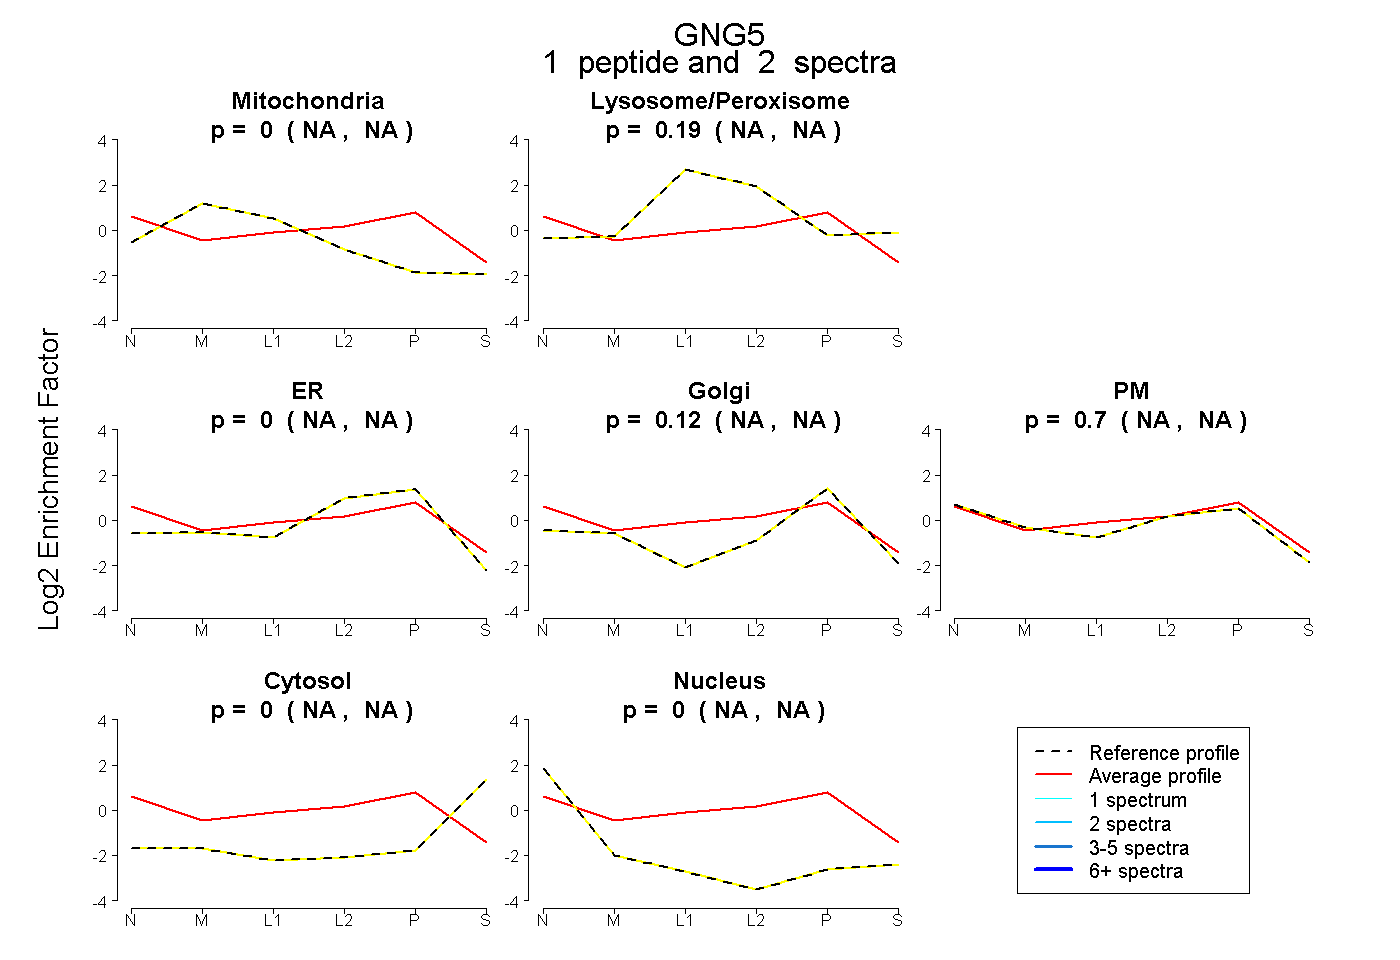
NA | NA
NA | NA
NA | NA
NA | NA
NA | NA
NA | NA
NA | NA
4peptides
spectra
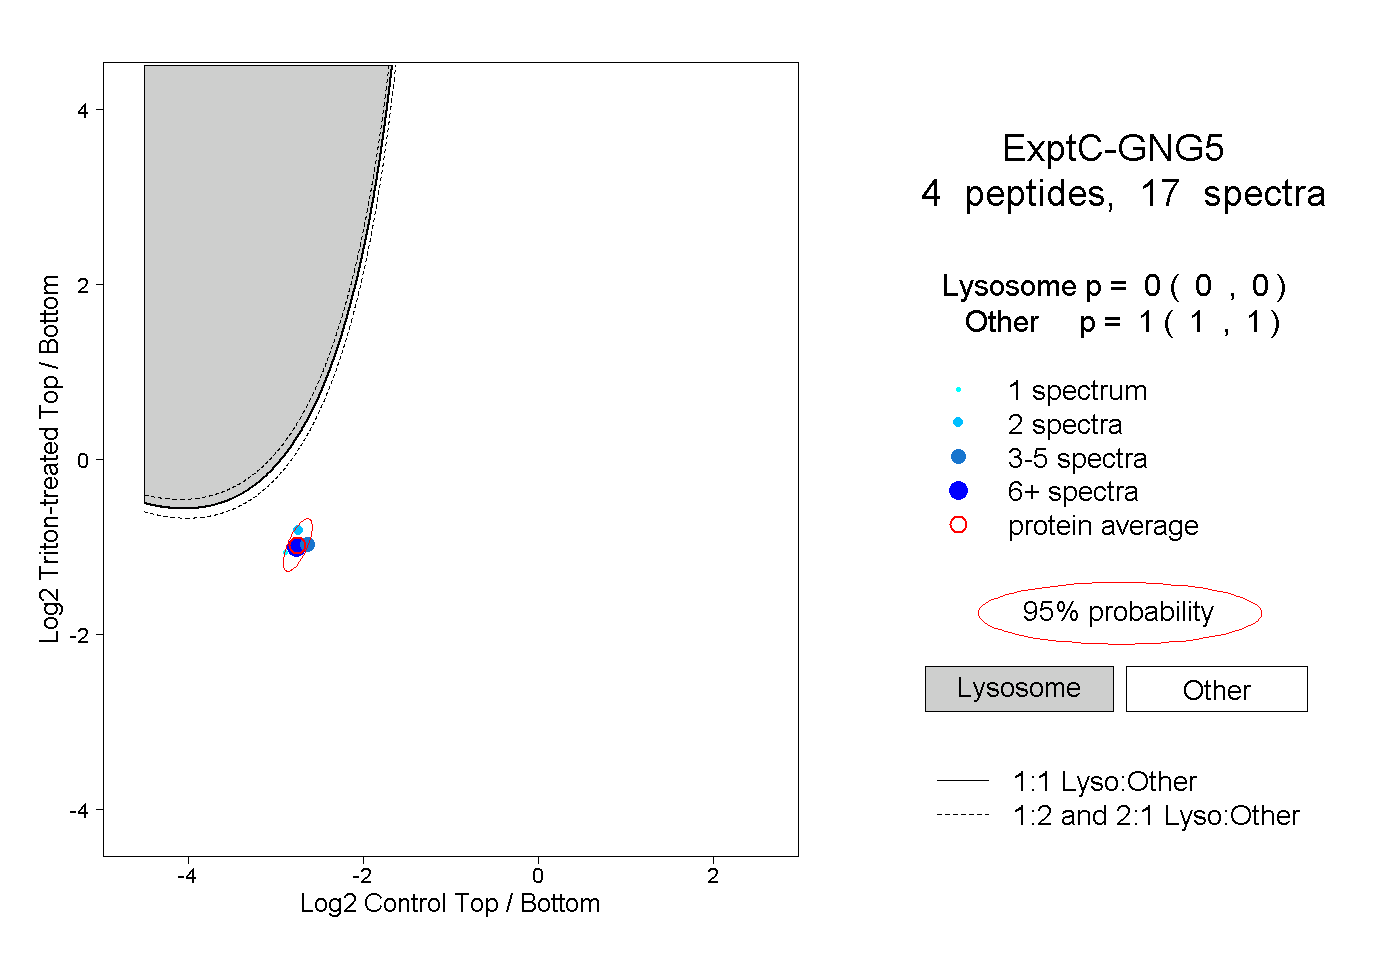
0.000 | 0.000
1.000 | 1.000
2peptides
spectra
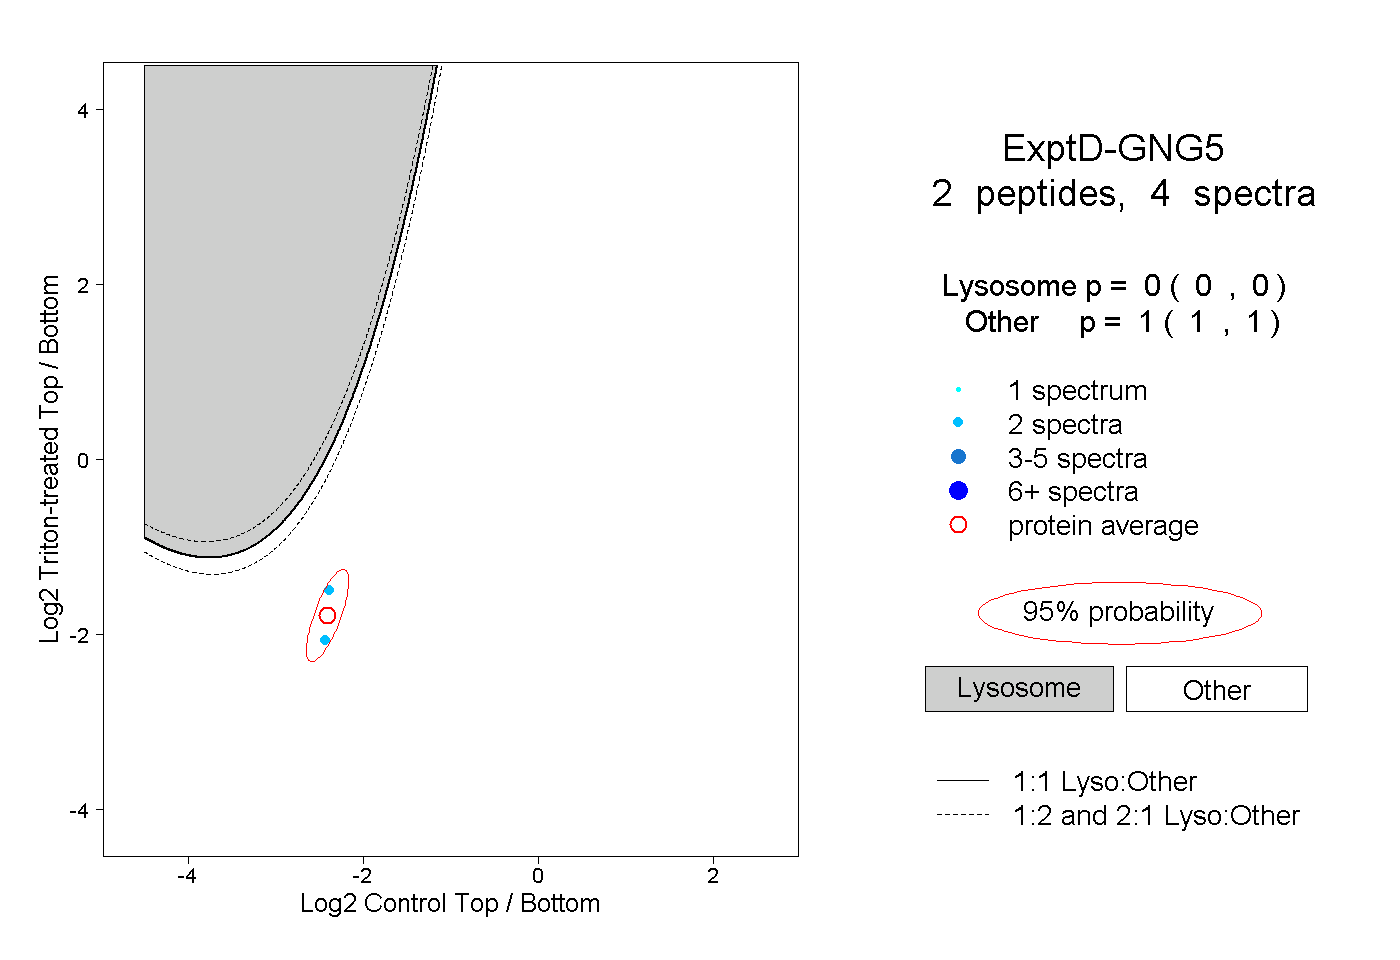
0.000 | 0.000
1.000 | 1.000