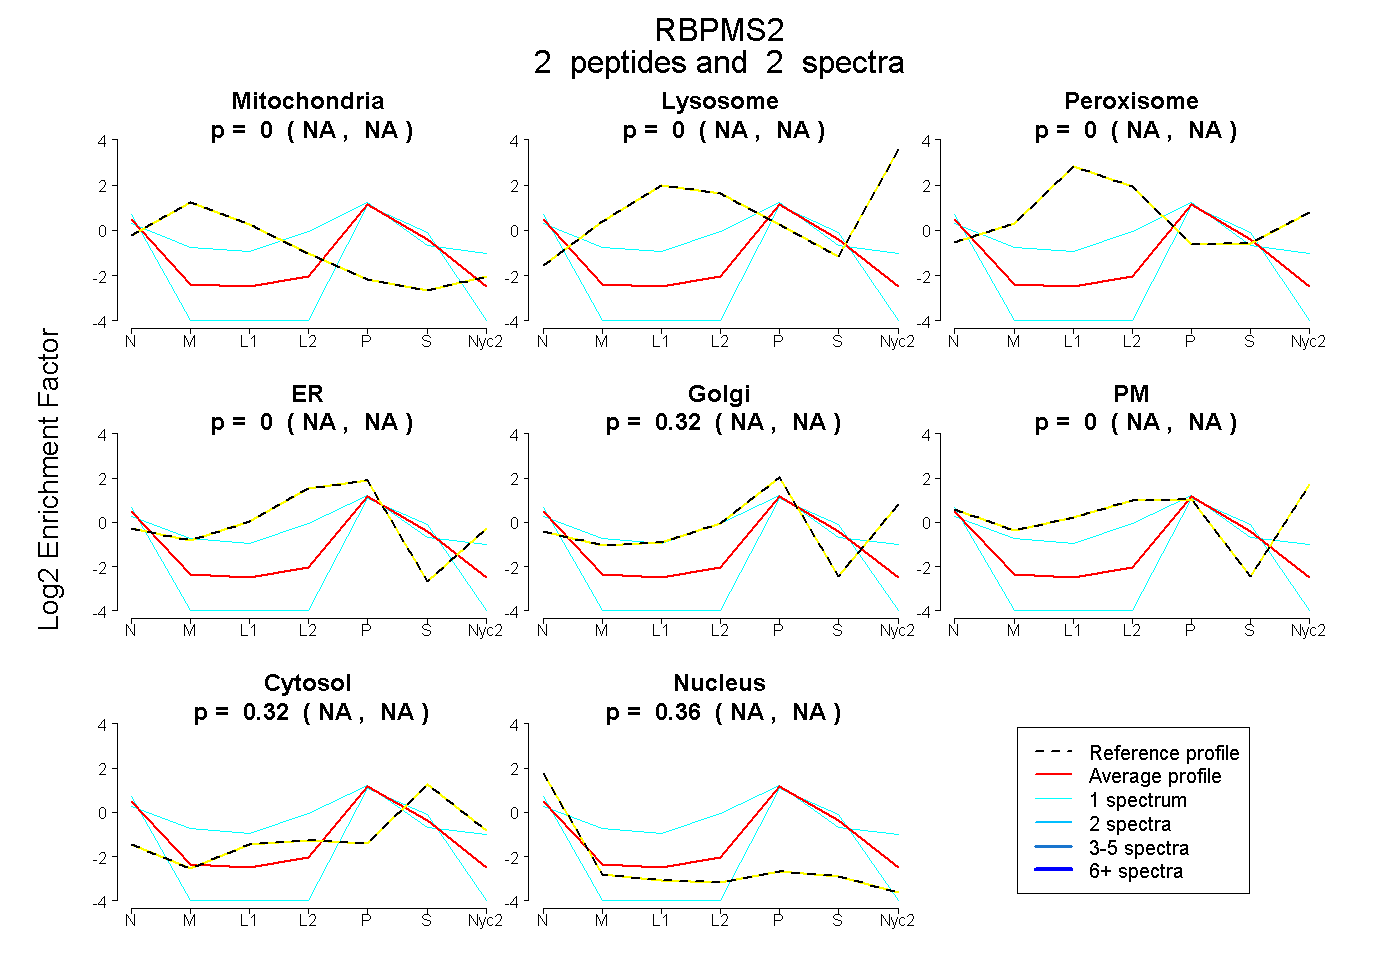
 2
2peptides
spectra
NA | NA
NA | NA
NA | NA
NA | NA
NA | NA
NA | NA
NA | NA
NA | NA
| Plot | Mito | Lyso | Perox | ER | Golgi | PM | Cytosol | Nucleus | |||||
| Expt A |
2 peptides |
2 spectra |
|
0.000 NA | NA |
0.000 NA | NA |
0.000 NA | NA |
0.000 NA | NA |
0.321 NA | NA |
0.000 NA | NA |
0.319 NA | NA |
0.360 NA | NA |
| 1 spectrum, TLFVSGLPVDIKPR | 0.019 | 0.000 | 0.000 | 0.472 | 0.149 | 0.000 | 0.289 | 0.070 | ||
| 1 spectrum, LIATPNPTSVHPALGAHLIAR | 0.000 | 0.000 | 0.000 | 0.000 | 0.000 | 0.000 | 0.354 | 0.646 |
| Plot | Lyso | Other | |||||||||||
| Expt C |
3 peptides |
10 spectra |
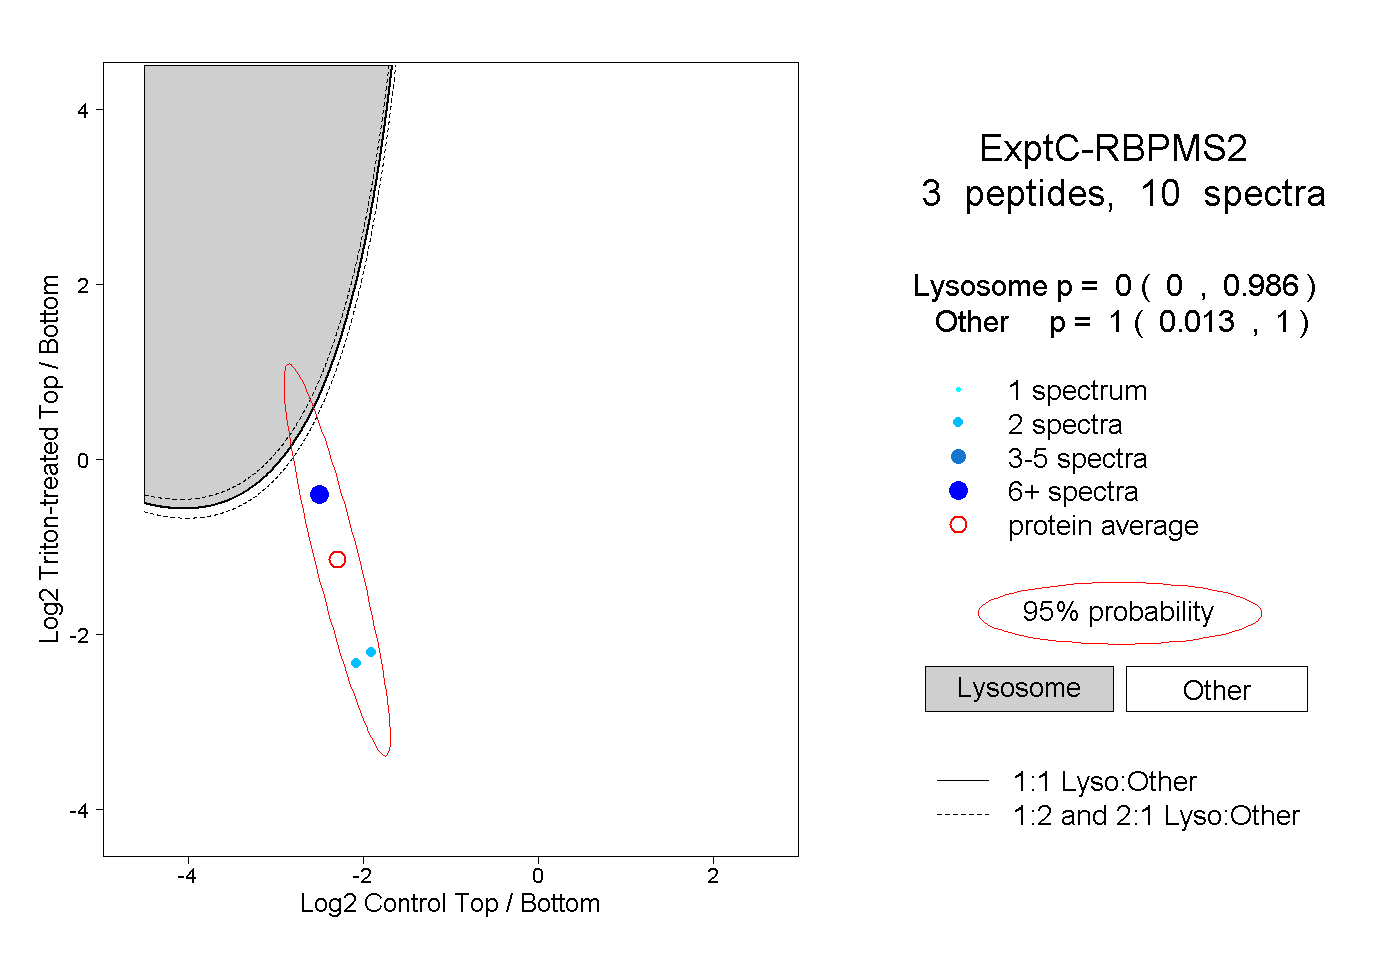 |
0.000 0.000 | 0.986 |
1.000 0.013 | 1.000 |