 16
16peptides
spectra
0.000 | 0.000
0.000 | 0.000
0.000 | 0.000
0.000 | 0.000
0.298 | 0.308
0.000 | 0.000
0.643 | 0.654
0.041 | 0.052
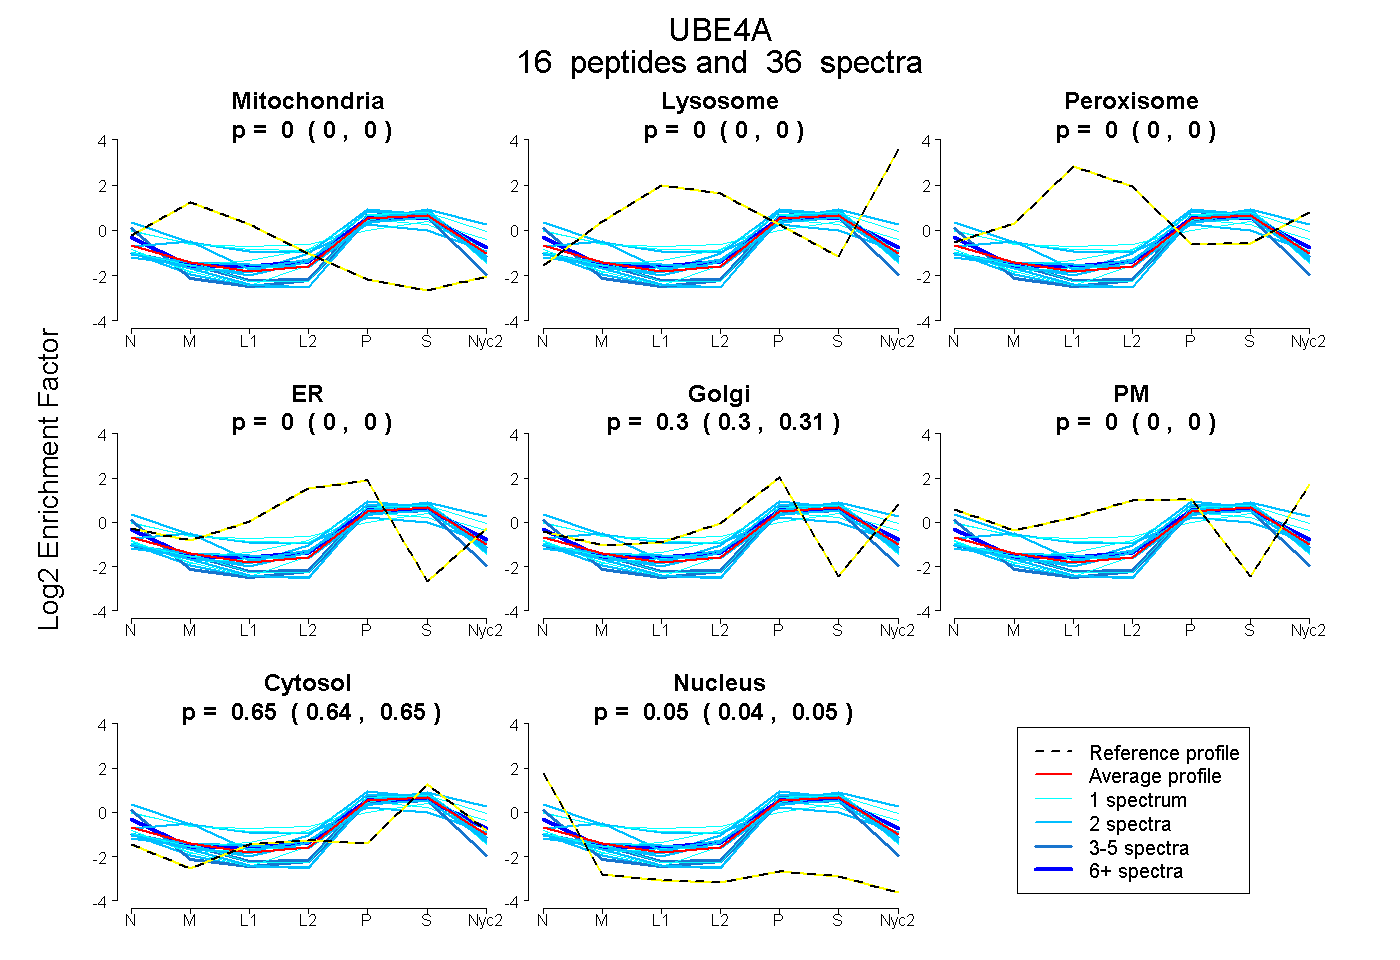
| Plot | Mito | Lyso | Perox | ER | Golgi | PM | Cytosol | Nucleus | |||||
| Expt A |
16 peptides |
36 spectra |
|
0.000 0.000 | 0.000 |
0.000 0.000 | 0.000 |
0.000 0.000 | 0.000 |
0.000 0.000 | 0.000 |
0.304 0.298 | 0.308 |
0.000 0.000 | 0.000 |
0.649 0.643 | 0.654 |
0.047 0.041 | 0.052 |
| 9 spectra, RPMYPILR | 0.000 | 0.000 | 0.000 | 0.000 | 0.340 | 0.000 | 0.618 | 0.042 | ||
| 2 spectra, NLTVSNTR | 0.000 | 0.000 | 0.000 | 0.000 | 0.345 | 0.000 | 0.655 | 0.000 | ||
| 1 spectrum, IFLITLDNSDPNLK | 0.140 | 0.000 | 0.047 | 0.000 | 0.354 | 0.000 | 0.458 | 0.000 | ||
| 2 spectra, DAQQSSSPAADNLR | 0.000 | 0.000 | 0.000 | 0.000 | 0.166 | 0.000 | 0.724 | 0.110 | ||
| 1 spectrum, YMWGTDSYR | 0.000 | 0.016 | 0.000 | 0.000 | 0.370 | 0.000 | 0.614 | 0.000 | ||
| 3 spectra, LQVAWR | 0.000 | 0.000 | 0.000 | 0.000 | 0.177 | 0.000 | 0.571 | 0.251 | ||
| 1 spectrum, INQNLHR | 0.099 | 0.000 | 0.062 | 0.000 | 0.087 | 0.228 | 0.524 | 0.000 | ||
| 1 spectrum, NLLQLSPETK | 0.000 | 0.000 | 0.000 | 0.000 | 0.232 | 0.000 | 0.688 | 0.080 | ||
| 2 spectra, VQEANIHQFMAQFHEK | 0.000 | 0.000 | 0.000 | 0.000 | 0.310 | 0.000 | 0.690 | 0.000 | ||
| 2 spectra, HLLSDQTDPFNR | 0.188 | 0.000 | 0.000 | 0.011 | 0.241 | 0.103 | 0.425 | 0.031 | ||
| 1 spectrum, SLFVHPFLAER | 0.000 | 0.000 | 0.000 | 0.000 | 0.252 | 0.000 | 0.727 | 0.021 | ||
| 2 spectra, SYSPTLFAQTVR | 0.000 | 0.000 | 0.000 | 0.000 | 0.184 | 0.000 | 0.710 | 0.106 | ||
| 1 spectrum, SPLTMDQIRPNTELK | 0.000 | 0.000 | 0.000 | 0.000 | 0.228 | 0.000 | 0.699 | 0.074 | ||
| 2 spectra, TPGVVENHGFFLNPSR | 0.143 | 0.000 | 0.000 | 0.000 | 0.270 | 0.000 | 0.587 | 0.000 | ||
| 4 spectra, EAGLQMFGQLAR | 0.000 | 0.000 | 0.000 | 0.000 | 0.249 | 0.000 | 0.689 | 0.062 | ||
| 2 spectra, VFCNFPYAPQLSEALIK | 0.000 | 0.017 | 0.000 | 0.000 | 0.300 | 0.000 | 0.683 | 0.000 |
| Plot | Mito | Lyso or Perox | ER | Golgi | PM | Cytosol | Nucleus | ||||||
| Expt B |
5 peptides |
8 spectra |
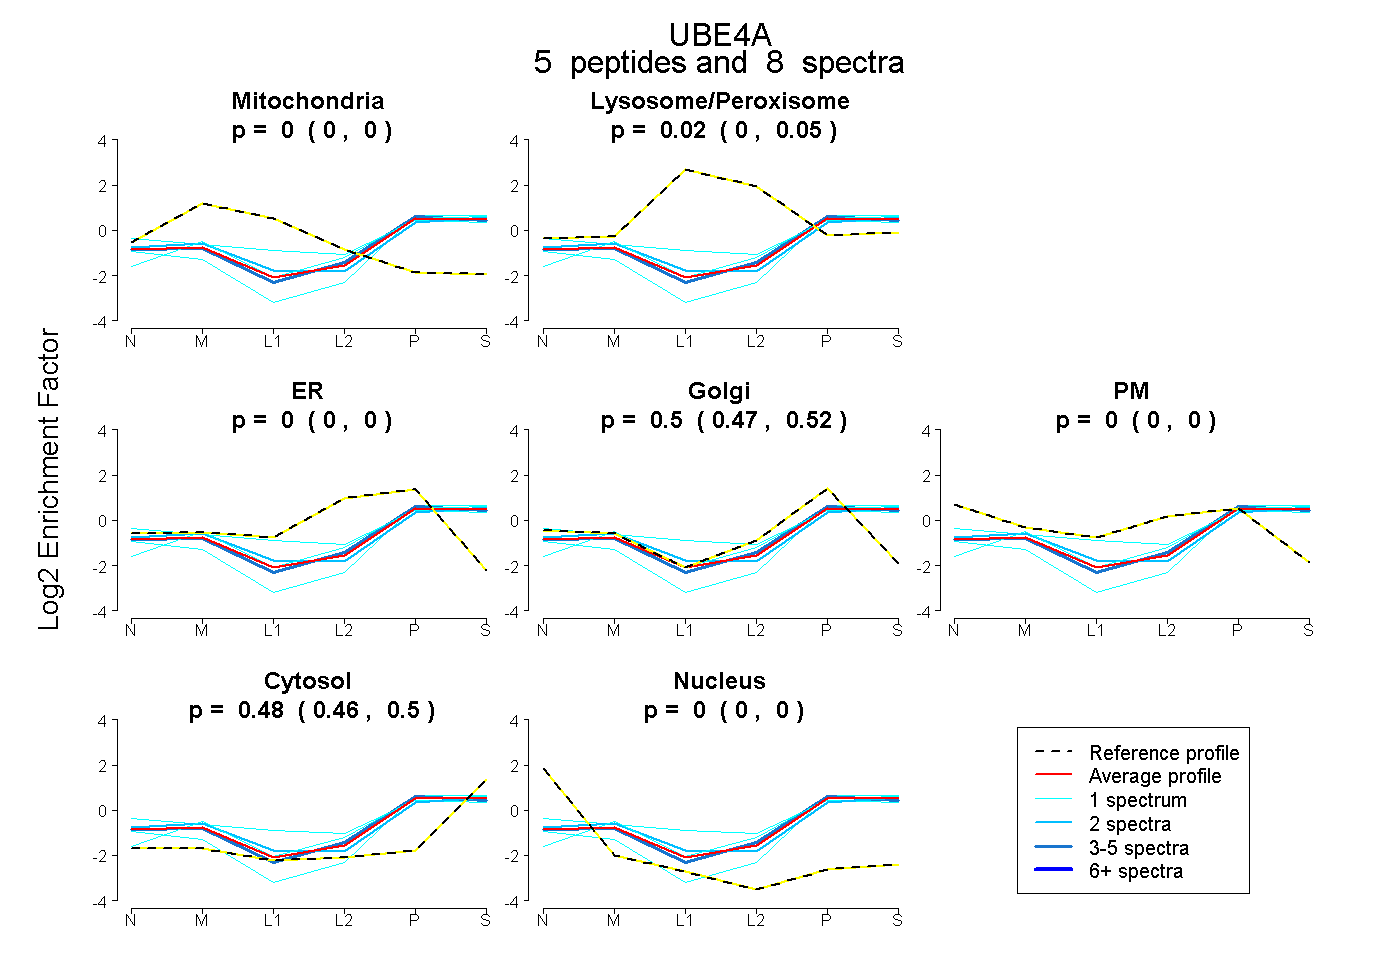 |
0.000 0.000 | 0.000 |
0.019 0.000 | 0.050 |
0.000 0.000 | 0.000 |
0.498 0.471 | 0.515 |
0.000 0.000 | 0.000 |
0.483 0.462 | 0.498 |
0.000 0.000 | 0.000 |
|||
| Plot | Lyso | Other | |||||||||||
| Expt C |
6 peptides |
12 spectra |
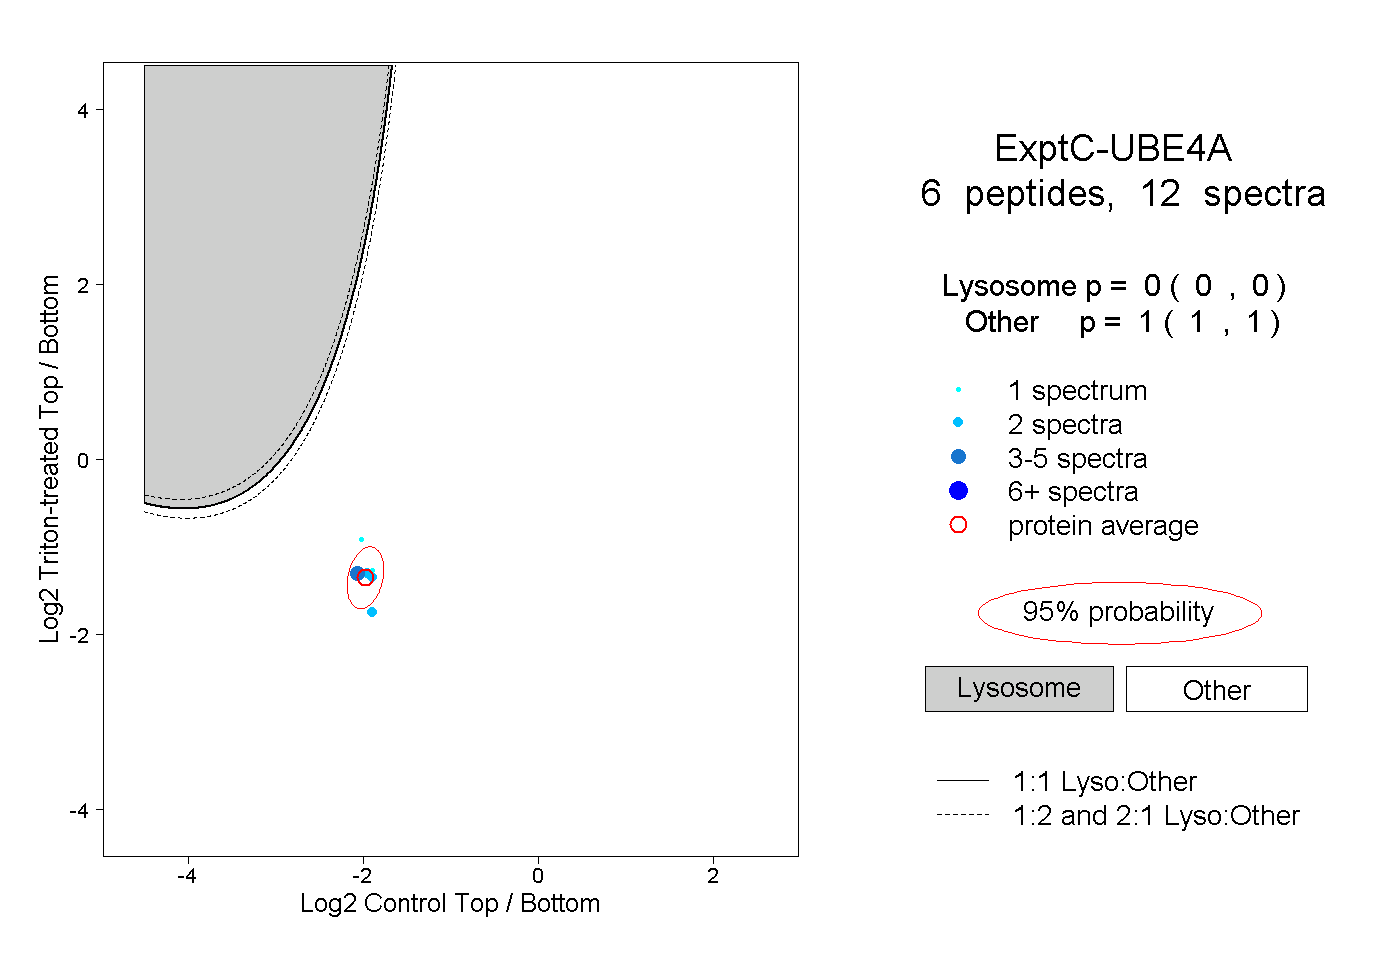 |
0.000 0.000 | 0.000 |
1.000 1.000 | 1.000 |
||||||||
| Plot | Lyso | Other | |||||||||||
| Expt D |
1 peptide |
1 spectrum |
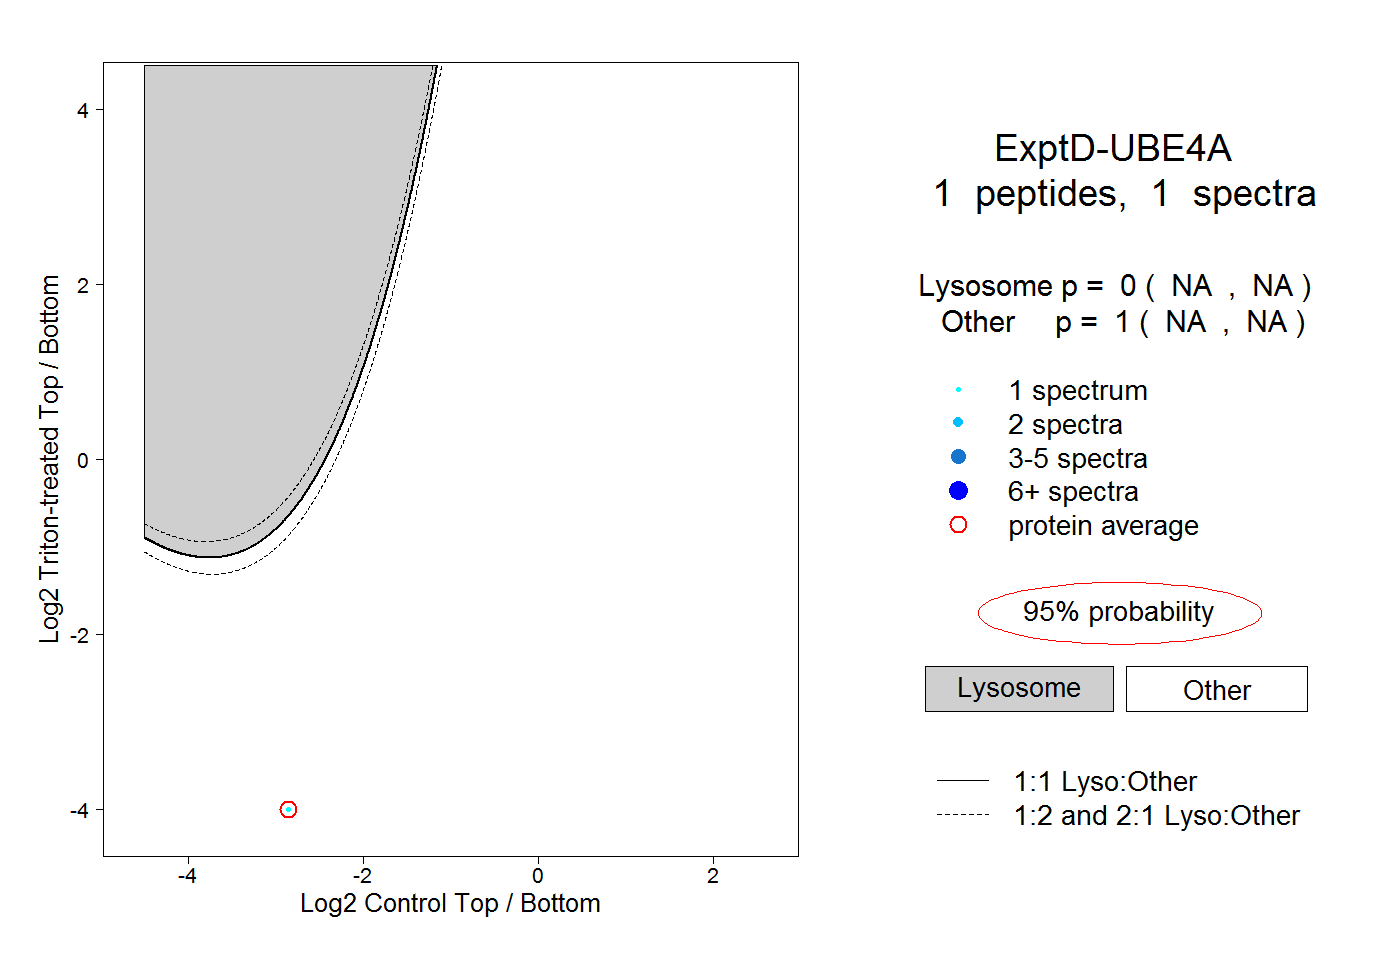 |
0.000 NA | NA |
1.000 NA | NA |