 6
6peptides
spectra
0.000 | 0.000
0.000 | 0.021
0.000 | 0.099
0.121 | 0.269
0.033 | 0.257
0.136 | 0.334
0.312 | 0.392
0.000 | 0.000
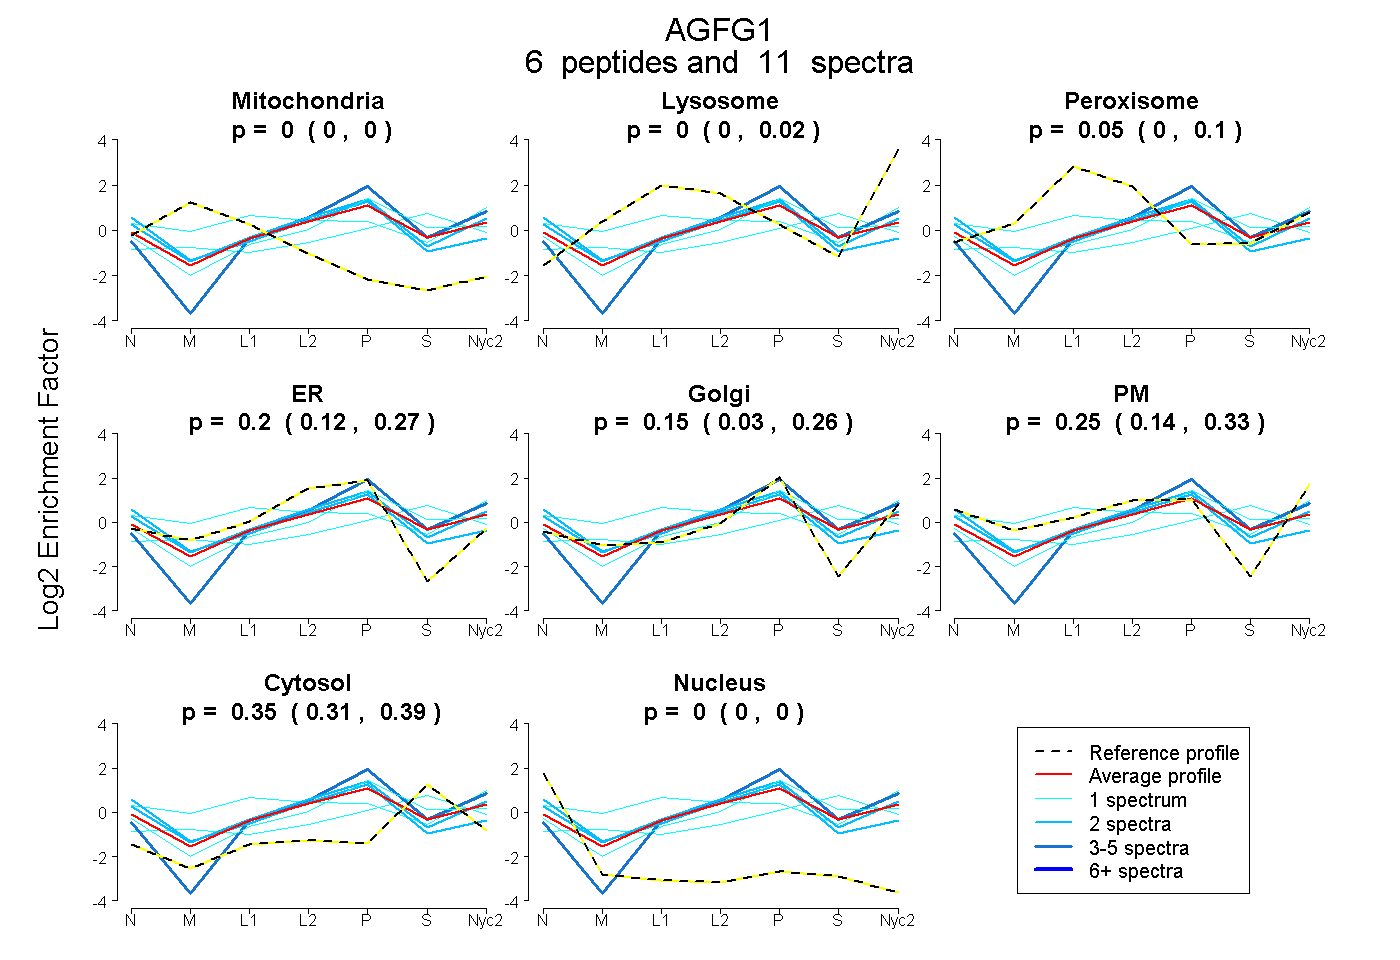
| Plot | Mito | Lyso | Perox | ER | Golgi | PM | Cytosol | Nucleus | |||||
| Expt A |
6 peptides |
11 spectra |
|
0.000 0.000 | 0.000 |
0.000 0.000 | 0.021 |
0.047 0.000 | 0.099 |
0.203 0.121 | 0.269 |
0.149 0.033 | 0.257 |
0.247 0.136 | 0.334 |
0.355 0.312 | 0.392 |
0.000 0.000 | 0.000 |
| 1 spectrum, AGLQTADK | 0.000 | 0.041 | 0.119 | 0.000 | 0.253 | 0.000 | 0.587 | 0.000 | ||
| 2 spectra, HGNEVCK | 0.000 | 0.000 | 0.000 | 0.483 | 0.018 | 0.195 | 0.258 | 0.046 | ||
| 2 spectra, QIWLGLFDDR | 0.000 | 0.000 | 0.000 | 0.255 | 0.087 | 0.385 | 0.273 | 0.000 | ||
| 1 spectrum, SQGQQQEK | 0.000 | 0.000 | 0.044 | 0.144 | 0.409 | 0.000 | 0.404 | 0.000 | ||
| 4 spectra, GTPTQSPVVGR | 0.000 | 0.029 | 0.000 | 0.174 | 0.459 | 0.000 | 0.337 | 0.000 | ||
| 1 spectrum, DMTGLPHNR | 0.000 | 0.000 | 0.303 | 0.000 | 0.000 | 0.498 | 0.198 | 0.000 |
| Plot | Mito | Lyso or Perox | ER | Golgi | PM | Cytosol | Nucleus | ||||||
| Expt B |
2 peptides |
3 spectra |
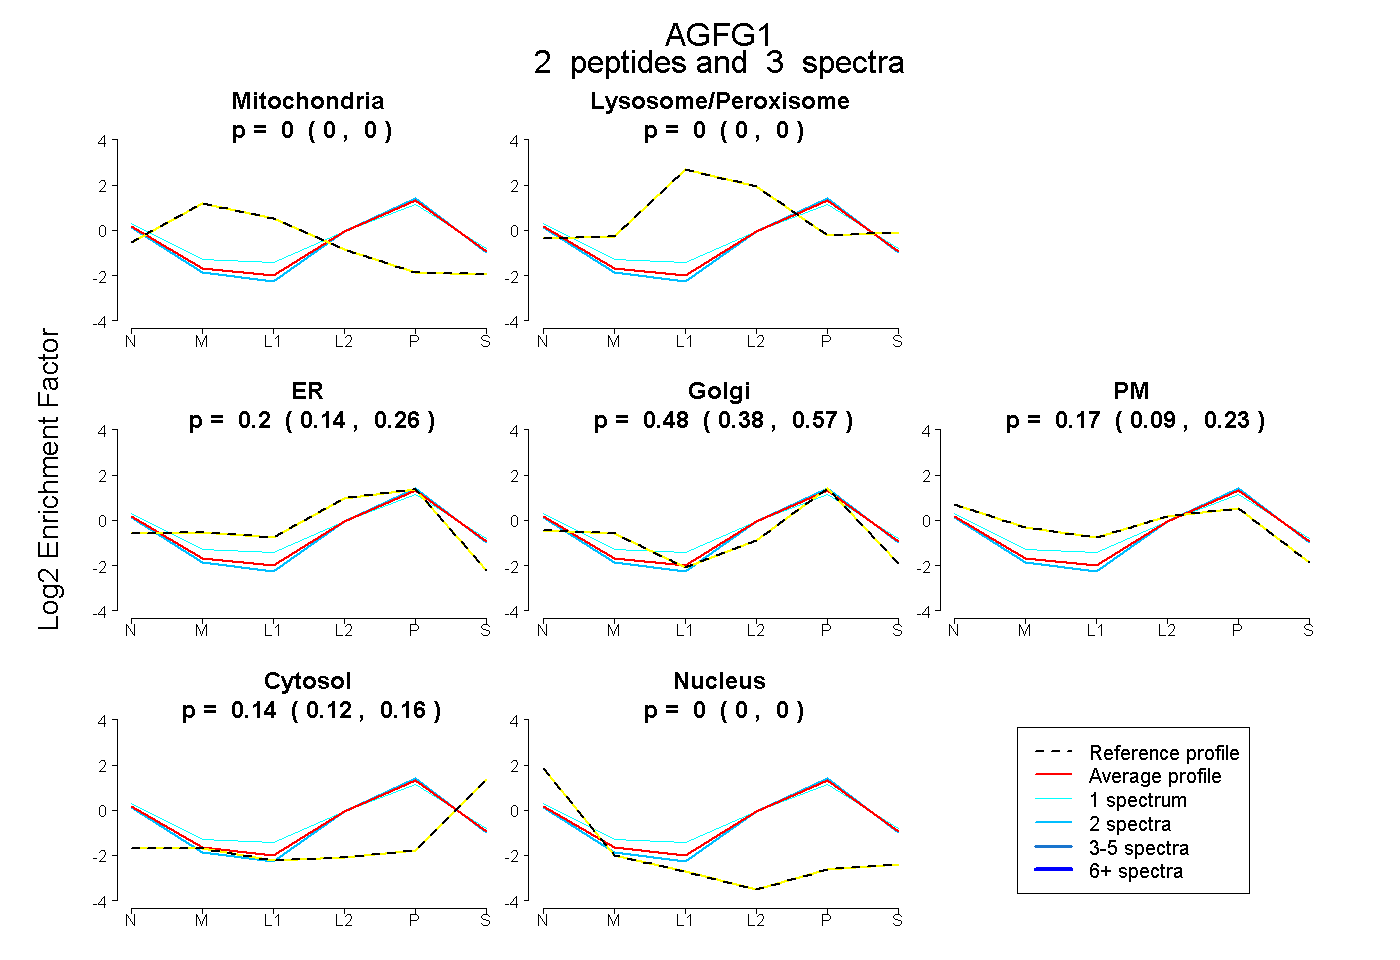 |
0.000 0.000 | 0.000 |
0.000 0.000 | 0.000 |
0.204 0.145 | 0.259 |
0.482 0.376 | 0.571 |
0.170 0.092 | 0.228 |
0.144 0.124 | 0.164 |
0.000 0.000 | 0.000 |
|||
| Plot | Lyso | Other | |||||||||||
| Expt C |
9 peptides |
31 spectra |
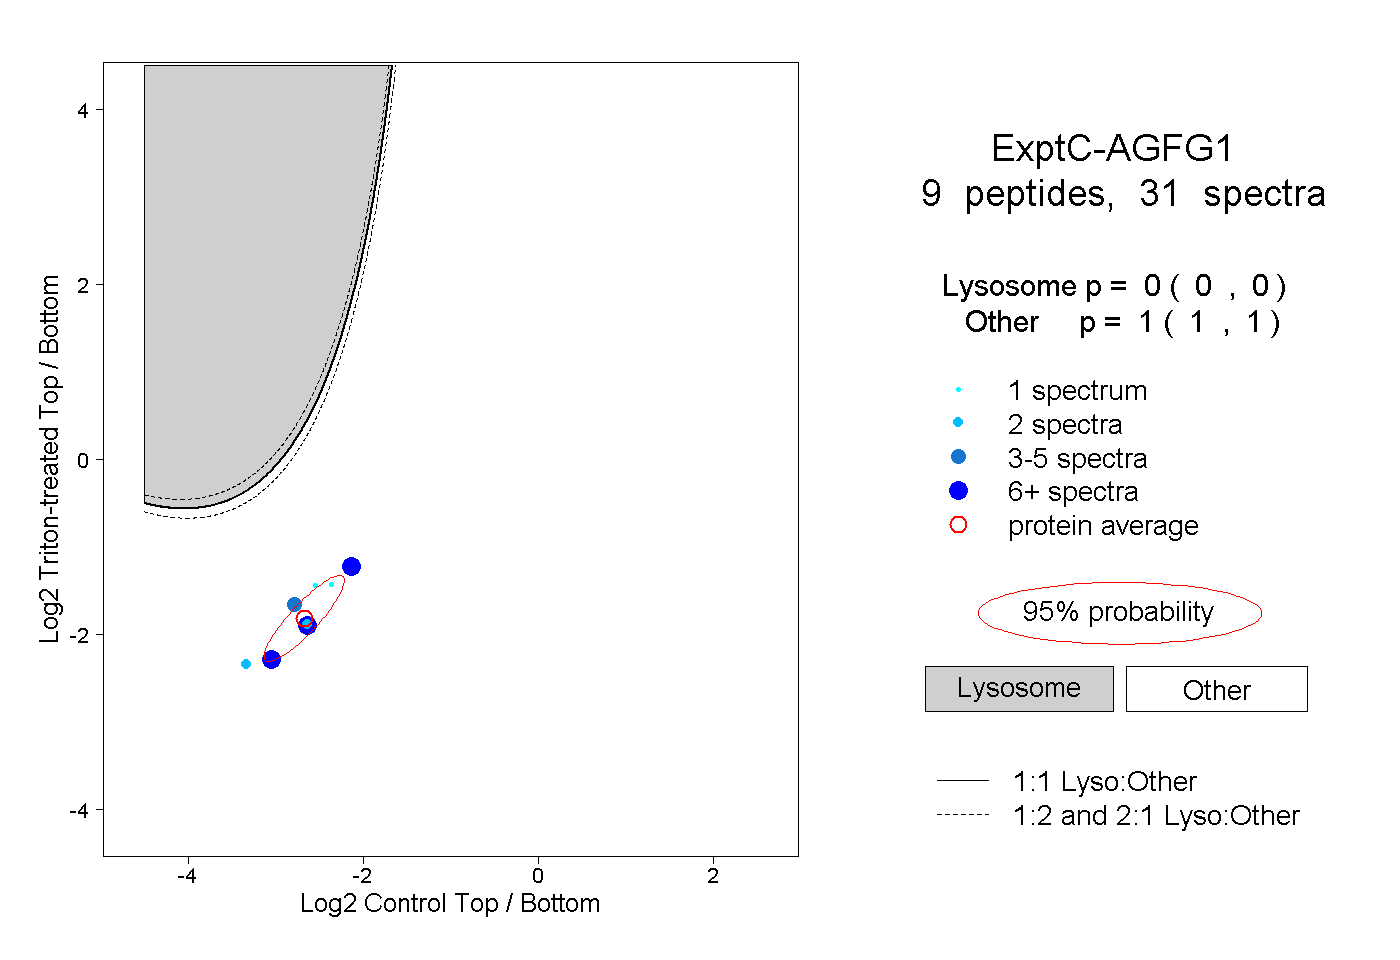 |
0.000 0.000 | 0.000 |
1.000 1.000 | 1.000 |
||||||||
| Plot | Lyso | Other | |||||||||||
| Expt D |
2 peptides |
2 spectra |
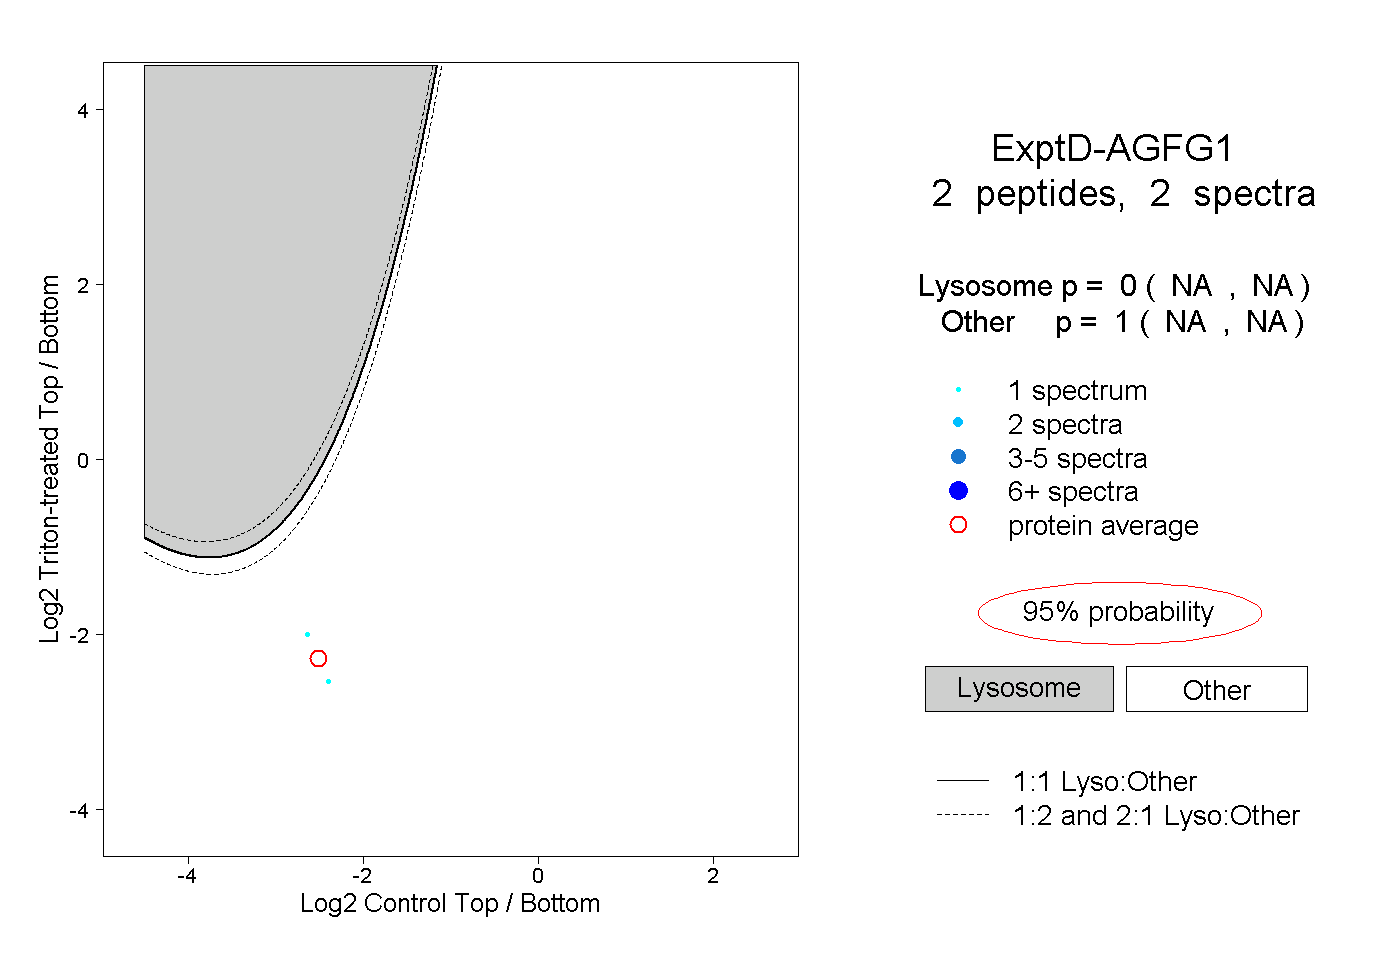 |
0.000 NA | NA |
1.000 NA | NA |